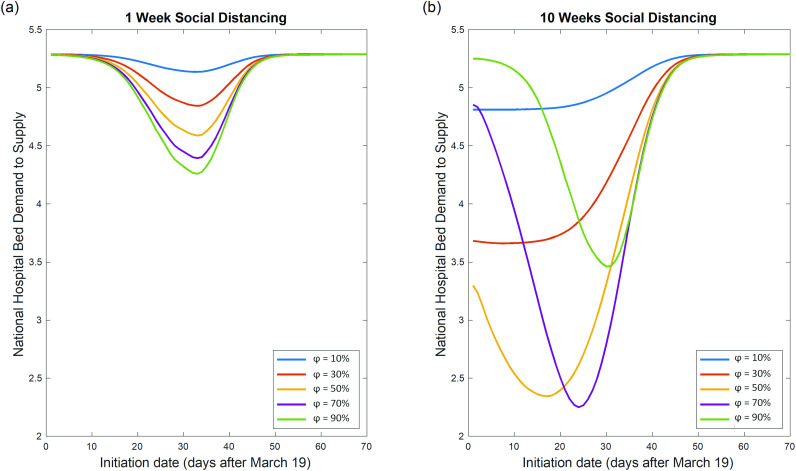
FIG. 4.
Interplay of intensity and implementation timing of finite-time social distancing. (a) Nationwide hospital bed demand-to-supply ratio is plotted as a function of implementation timing for various social distancing intensities with a duration of 1 week. For social distancing lasting 1 week, stronger social distancing could lead to decreased medical demand if social distancing is implemented at the optimal time. (b) Nationwide hospital bed demand-to-supply ratio is plotted as a function of implementation timing for various social distancing intensities for a duration of ten weeks. For social distancing lasting ten weeks, stronger social distancing does not necessarily lead to decreased medical demand, even if social distancing is implemented at the optimal time .

