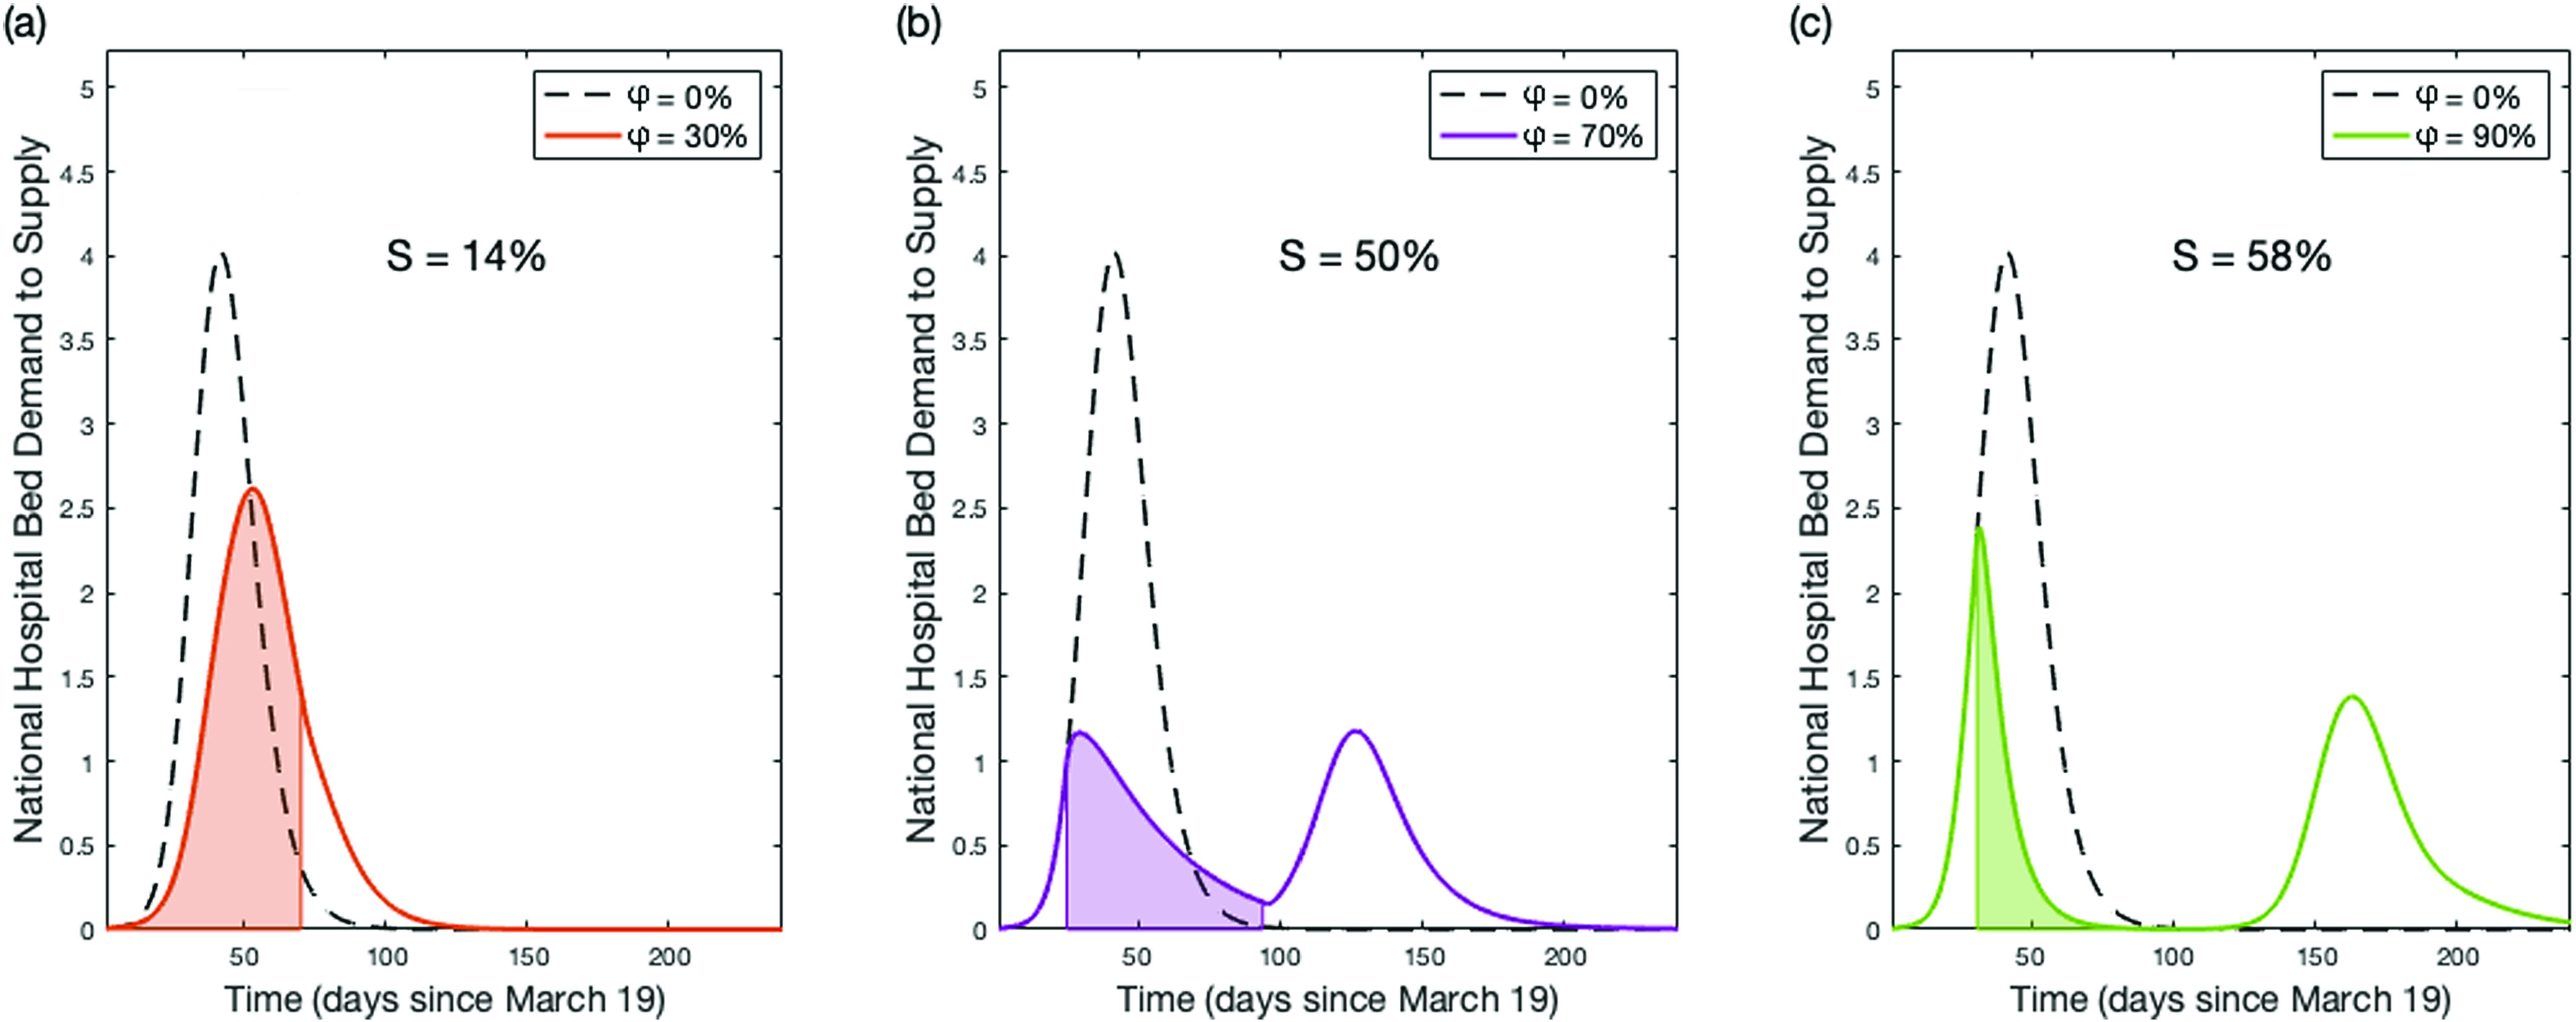
FIG. 6.

Epidemic dynamics of ten-week social distancing with varying intensities . Epidemic dynamics for ten weeks social distancing initiated at with = 30% (a), = 70% (b), and = 90% (c). Shaded regions denote the period where social distancing is in effect. The magnitude of the second peaks seen in panels (b) and (c) are controlled by the percentage of susceptible individuals (S) within the population when social distancing ends. If the susceptible population is very large when social distancing ends, a second wave of infections will spread throughout the population.
