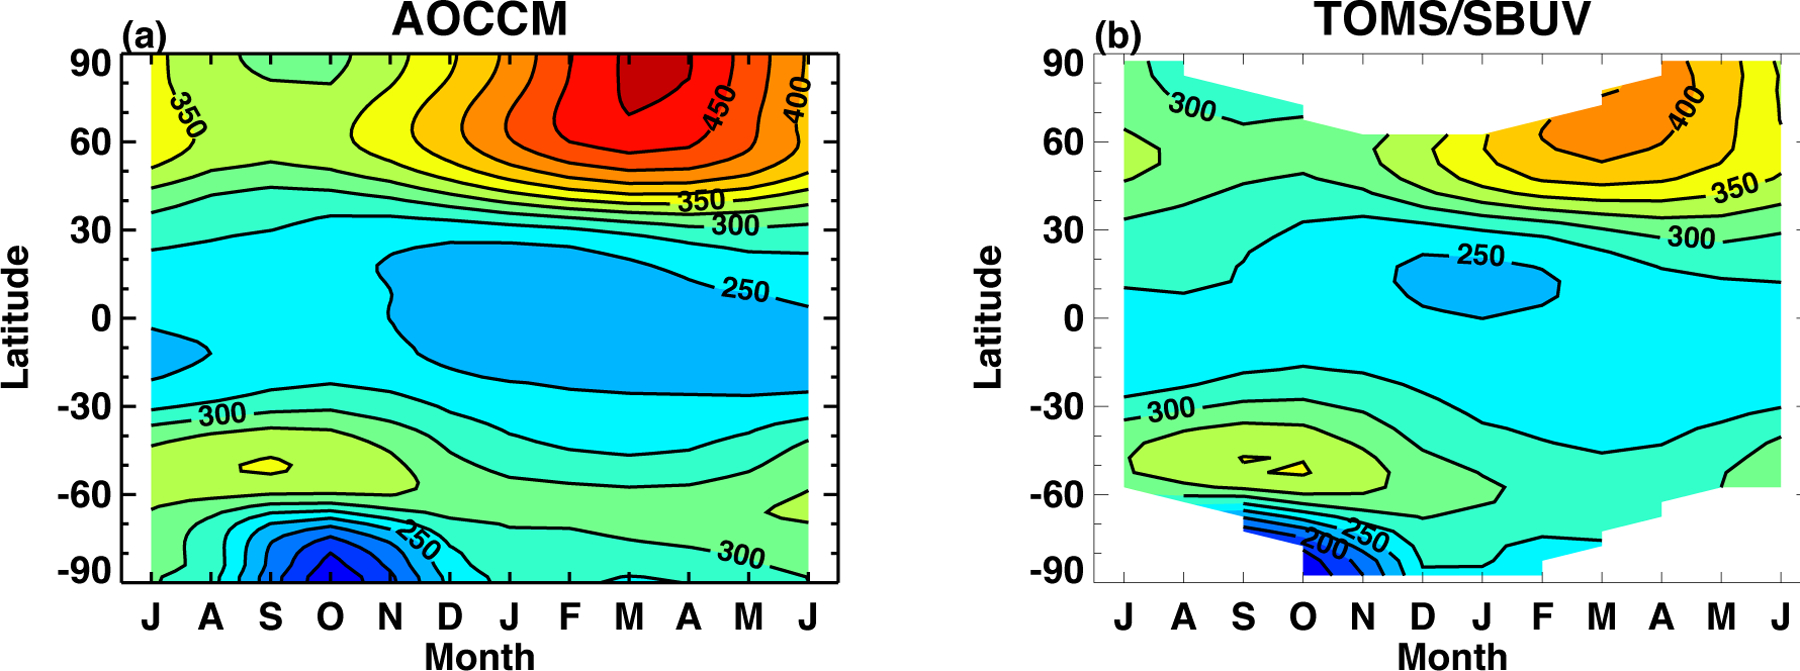
Figure 1:

Zonal-mean total column ozone distributions in 1990–2010 as a function of month and latitude. (a) GEOS AOCCM interactive chemistry simulations. (b) Merged SBUV/TOMS total ozone data. Contour interval is 25 Dobson Unit. No observations in polar night.
