
Figure 11:
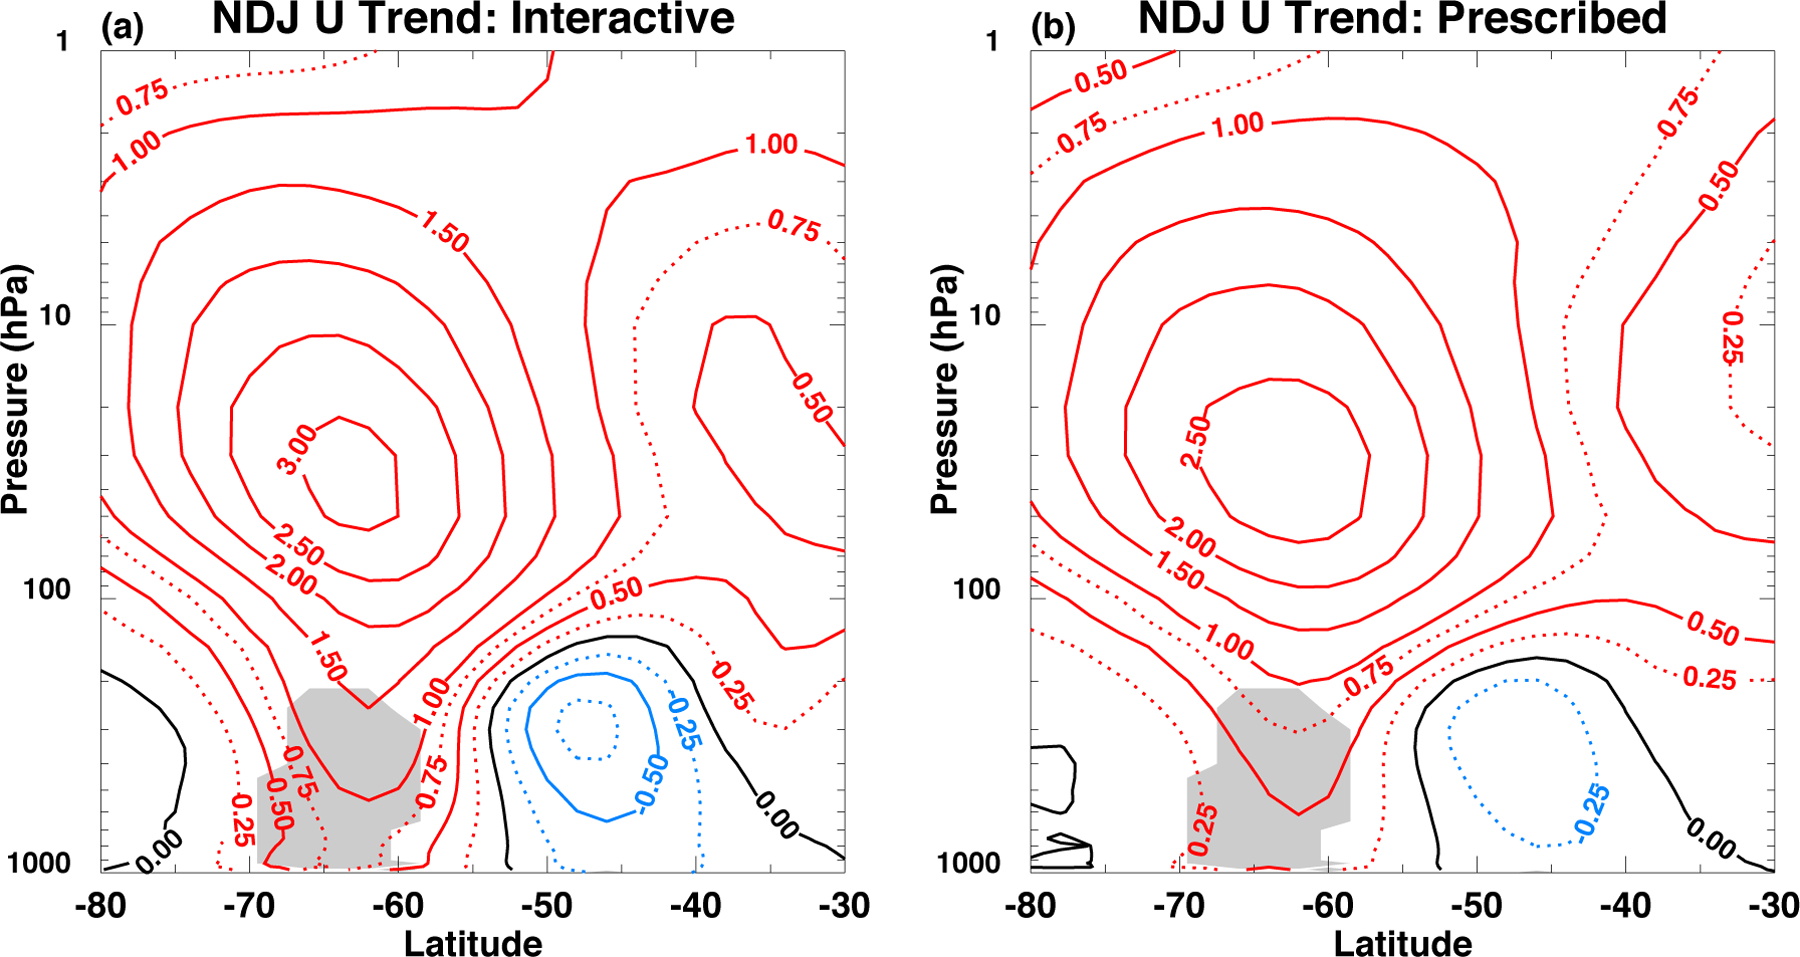
Linear trends of November-December-January zonal-mean zonal wind in 1979–2010 in (a) interactive chemistry simulations and (b) prescribed ozone simulations. Unit is m/s/decade. The trends with magnitude of greater than about 0.25 m/s/decade are statistically significant at the 2-tailed 5% level. Shading indicates that the trends in the interactive simulations are significantly stronger than those in the prescribed simulations at the 5% level using a one-tailed t test.