
Figure 14:
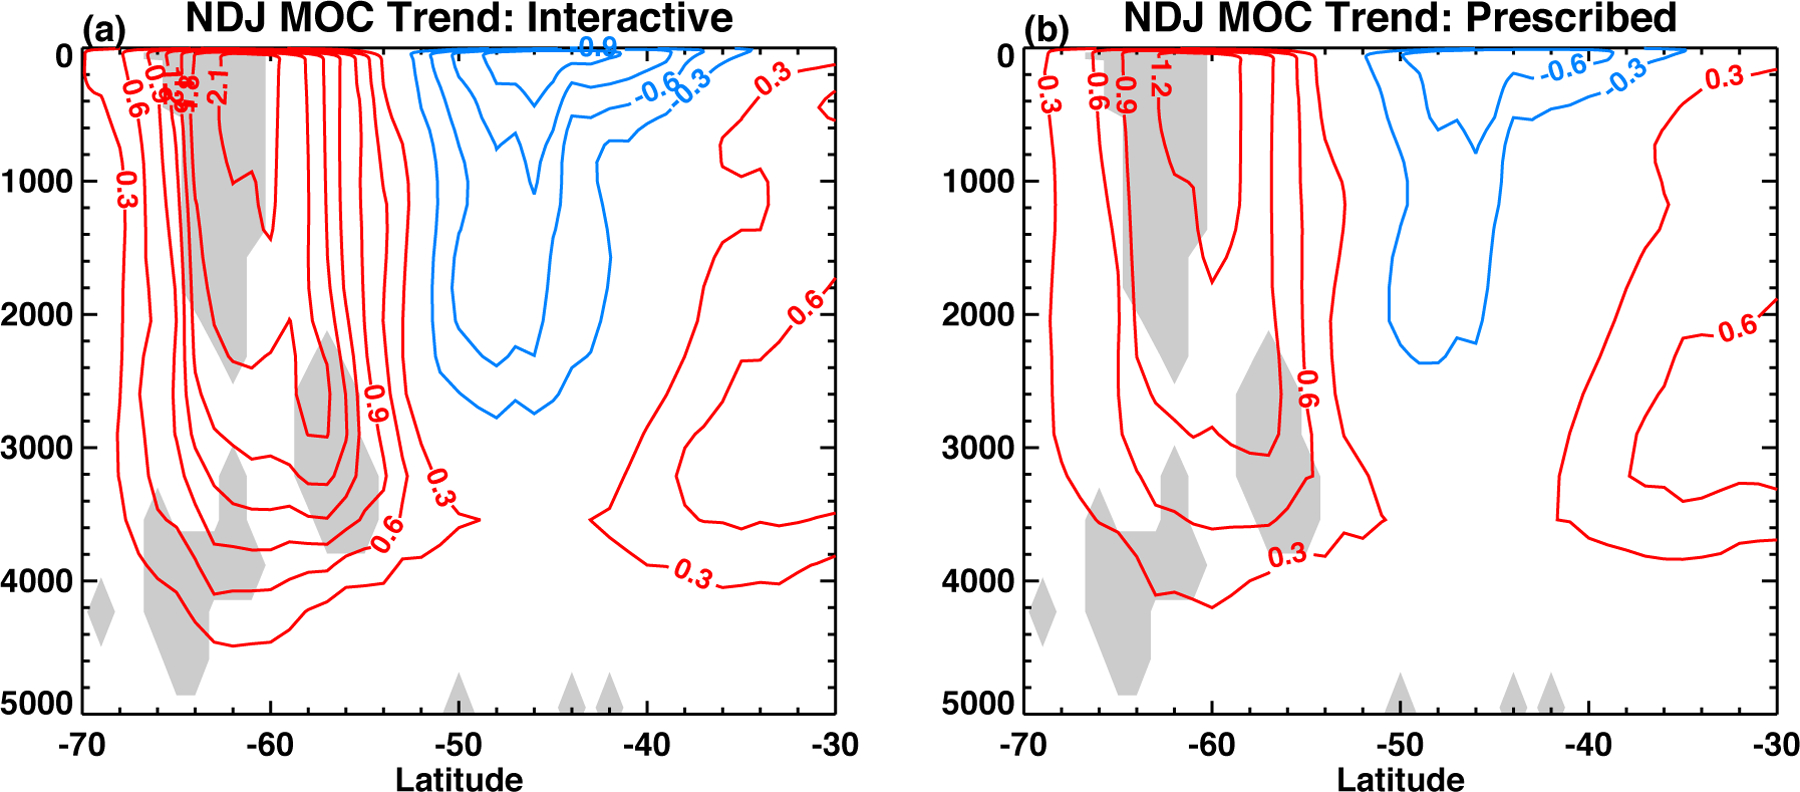
Trends of the November-December-January Southern Ocean MOC streamfunction in 1979–2010 in (a) interactive chemistry and (b) prescribed ozone simulations. Poleward of 55°S, trends with magnitude grater than about 0.3 Sv/decade are statistically significant from zero at the 2-tailed 5% level. Equatorward of 55°S, trends with magnitude greater than about 0.6 Sv/decade are statistically significant. Shading indicates where the MOC trends in the interactive simulations are significantly stronger than those in the prescribed simulations at the 1-tailed 5% level. Unit of the trends is Sv/decade.