
Figure 16:
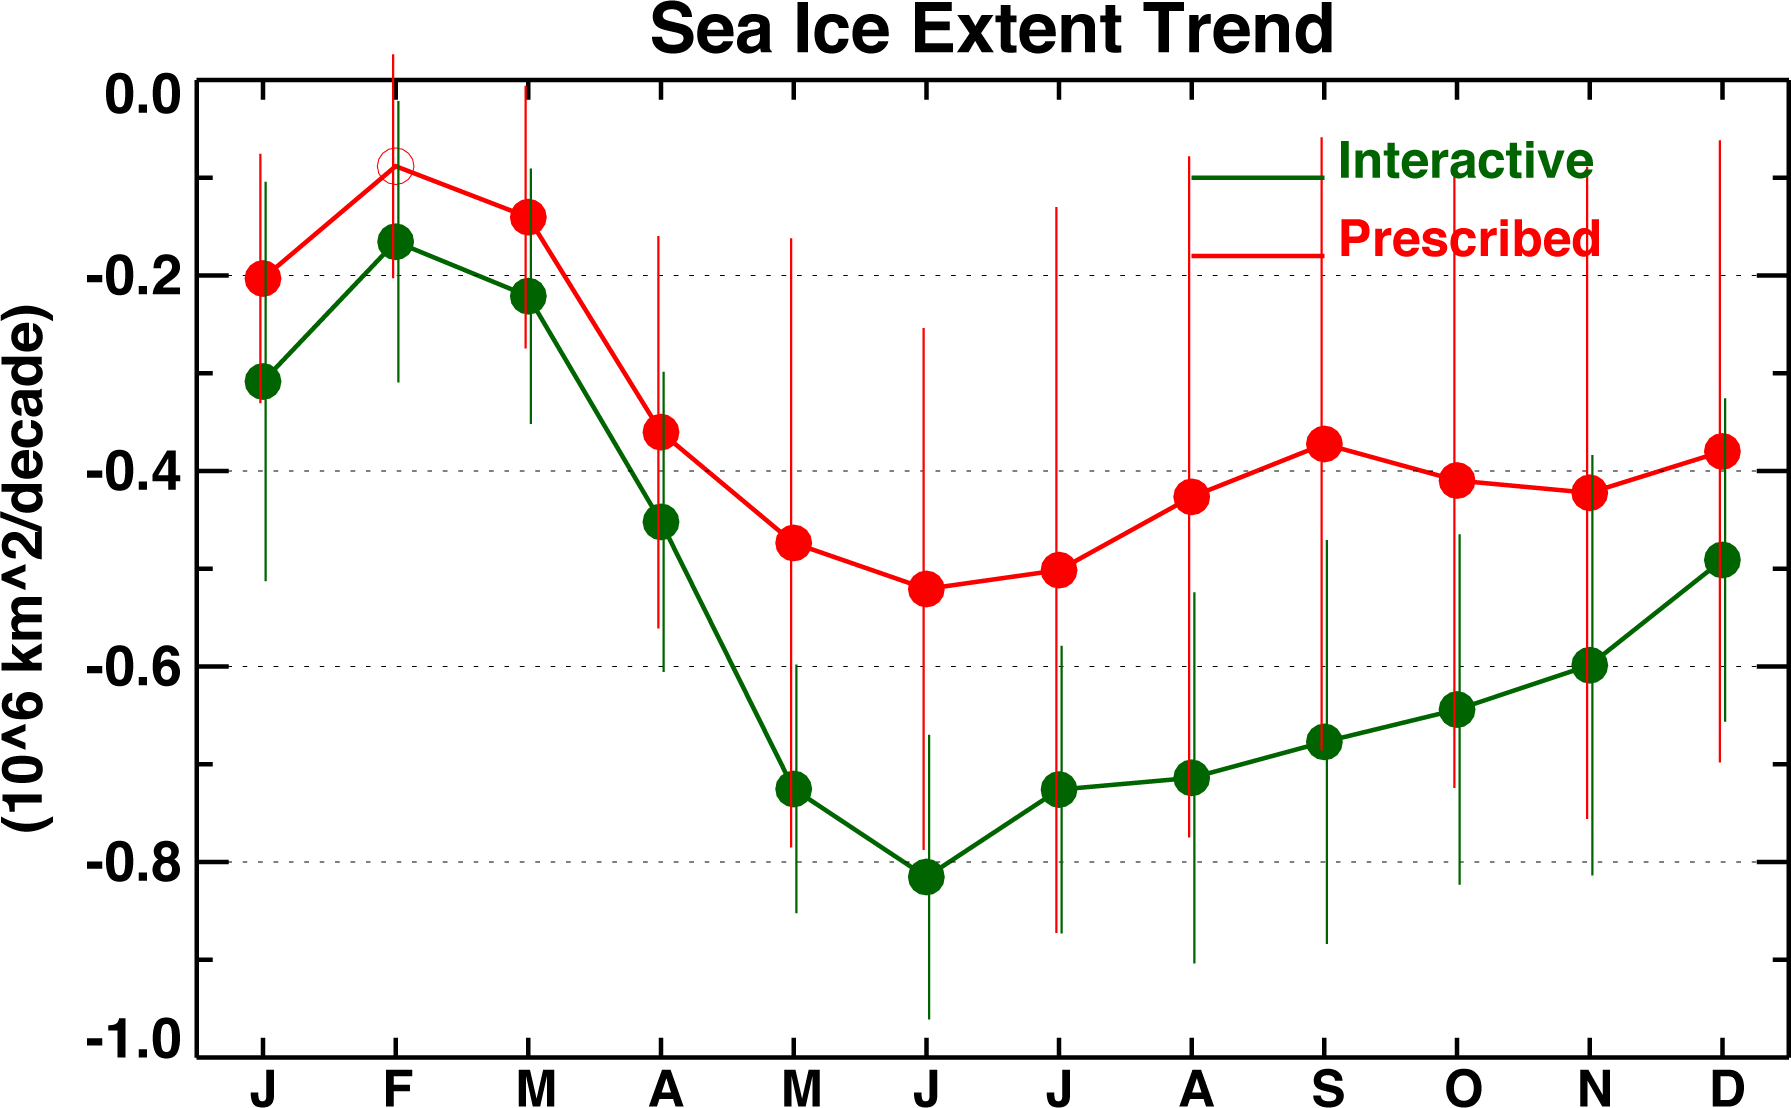
Monthly trends of the Antarctic sea ice extent in 1979–2010 in the interactive chemistry (green) and prescribed ozone (red) simulations. Error bars are the 95% confidence interval of the trends. Filled circles indicate that the trends are statistically significant at the 5% level.