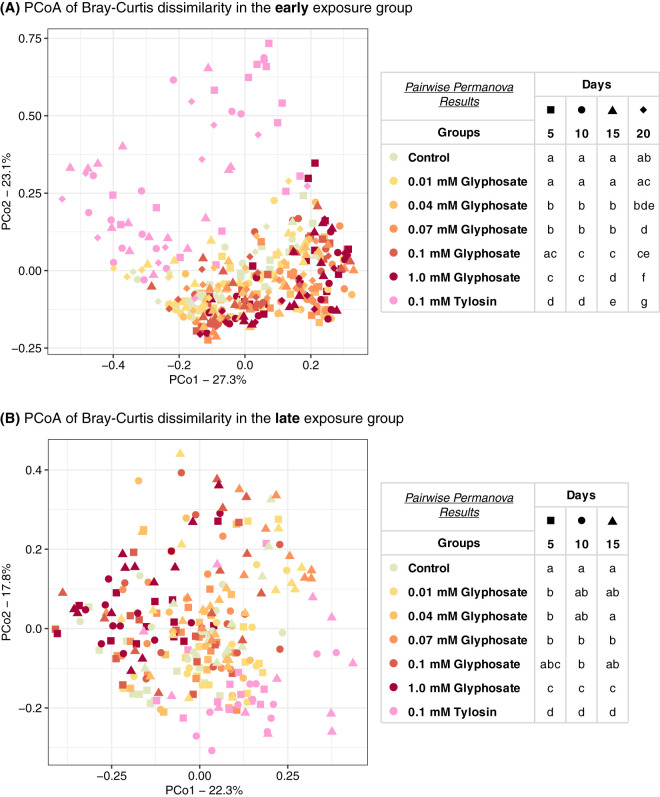
FIG 7.
Principal-coordinate plots of gut community compositions of bees treated with glyphosate or tylosin at different stages of gut microbial acquisition using Bray-Curtis dissimilarity. (A) Bees at 1 day postemergence were treated with glyphosate or tylosin for 20 days (early exposure). Control bees, 0.01, 0.04, 0.07, 0.1, and 1.0 mM glyphosate-fed bees, and 0.1 mM tylosin-fed bees were sampled at days 5 (n = 15 each), 10 (n = 15 each), 15 (n = 15, 15, 15, 15, 15, 14, and 15), and 20 (n = 10, 10, 11, 11, 11, 11, and 10). (B) Bees at 5 days postemergence were treated with glyphosate or tylosin for 15 days (late exposure). Control bees, 0.01, 0.04, 0.07, 0.1, and 1.0 mM glyphosate-fed bees, and 0.1 mM tylosin-fed bees were sampled at days 5 (n = 13, 13, 13, 13, 13, 13, and 12), 10 (n = 12 each), and 15 (n = 12 each) after the start of treatment. Within each sampling day, groups with different letters are statistically significantly different (P < 0.05, pairwise PERMANOVA with 999 permutations) (Table S4).

