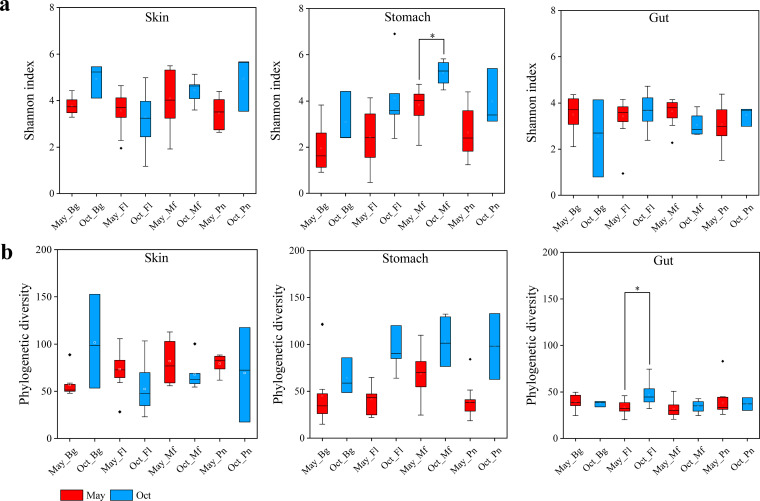
FIG 2.
Box plots of alpha diversity of the symbiotic microbiomes in the four frog species. (a) Shannon index comparisons for the skin, stomach, and gut microbes between May and October (Oct) samples in each frog species. (b) Phylogenetic diversity comparisons for the skin, stomach, and gut microbes between May and October samples in each frog species. Bg, Bufo gargarizans samples; Fl, Fejervarya limnocharis samples; Mf, Microhyla fissipes samples; Pn, Pelophylax nigromaculatus samples. The Mann-Whitney U test was used to analyze the differences between the May and October samples in each type of symbiotic microbiome within the same frog species. *, P < 0.002 after the Dunn-Sidàk correction. The upper and lower whiskers represent scores outside the middle 50% (i.e., the lower 25% of scores and the upper 25% of scores). The minimum score is the lowest score, excluding outliers (shown at the end of the down whisker). The maximum score is the highest score, excluding outliers (shown at the end of the top whisker). In the boxes, the upper lines represent the upper quartiles (75th percentiles), the bottom lines represent the lower quartiles (25th percentiles), the lines between the upper and bottom lines represent the median values, and the squares represent mean values. The black diamonds represent the outliers.

