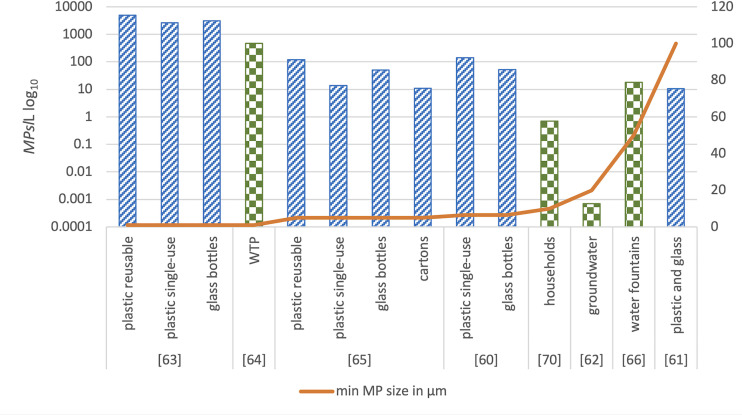
Fig 4. MP content in TW and BW.
MP content (MPs/L) is illustrated in the left-hand side y axis in log10 scale. BW: diagonal stripes, TW: chequerboard, Minimum particle size included in each study is illustrated in the right-hand side y axis. Studies by Tong et al. [68], Wiesheu et al. [69] and Zuccarello et al. [71] were not included because they were rated as of high RoB.

