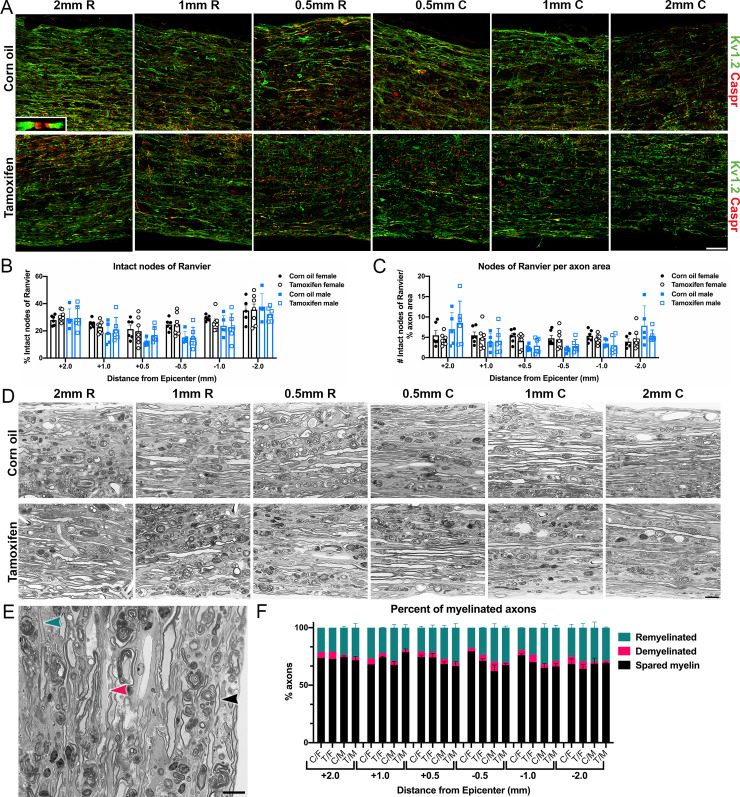
Fig 9. Demyelination and remyelination are unaffected by delayed short-term tamoxifen administration.
(A) Representative confocal images of longitudinal spinal cords immunolabeled for Kv1.2 and Caspr at 2 mm, 1 mm, and 0.5 mm rostral and caudal to the lesion epicenter. Inset shows a higher-power view of a node of Ranvier. Scale bar = 75 μm. (B) Percent of intact nodes of Ranvier in the lateral white matter at each sampled region. (C) Number of intact nodes of Ranvier normalized to percent axon area (Fig 4) in the lateral white matter at each sampled region. (D) Representative images of semi-thin longitudinal sections stained for toluidine blue from corn oil and tamoxifen mice at 2 mm, 1 mm, and 0.5 mm rostral and caudal to the lesion epicenter. Scale bar = 10 μm. (E) High-power image with arrowheads showing an example of a spared myelinated axon (black), demyelinated axon (pink), and remyelinated axon (teal). Scale bar = 10 μm. (F) Percent of spared myelinated, demyelinated, and remyelinated axons of total axons in each section. C/F = corn oil female; T/F = tamoxifen female; C/M = corn oil male; T/M = tamoxifen male. (B-C, F) The data are not significantly different between groups at any distance from the lesion epicenter. Data presented as mean + SEM. Mixed-effects analysis with Šídák post hoc test. (B-C) Corn oil female n = 6; tamoxifen female n = 7; corn oil male n = 5; tamoxifen male n = 6. (F) Corn oil female n = 1–3; tamoxifen female n = 1–3; corn oil male n = 3; tamoxifen male n = 3.

