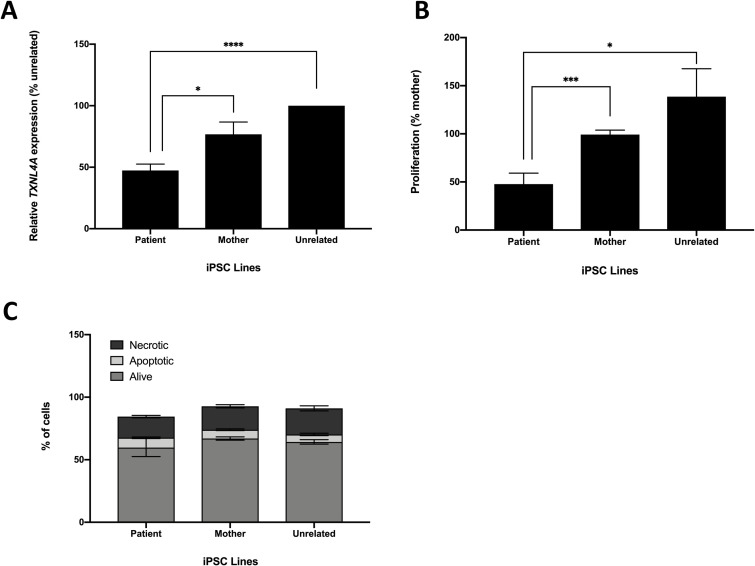
Fig 1. Characteristics of BMKS patient-, mother- and unrelated control-derived iPSCs.
For the analyses, data from two patient iPSC lines, two parent iPSC lines and two unrelated control iPSC lines were pooled. A) Relative TXNL4A mRNA expression levels for patient iPSCs compared to mother iPSCs and unrelated control iPSCs, determined using qPCR of cDNA from each cell line. Graphs were obtained using the ΔΔCT method with ACTB as the endogenous reference gene and normalised to the unrelated control line SW171A. n = 4. B) Relative proliferation for patient iPSCs compared to mother iPSCs and unrelated control iPSCs using an MTT assay to monitor cell proliferation, normalised to the KW191A maternal line. n = 4. C) Percentages of apoptotic, necrotic and live cells for patient, mother and unrelated control iPSCs determined using co-staining with annexin-V and DAPI then quantification of cell subpopulations by flow cytometry. n = 3. * p-value < 0.05, ** p-value < 0.01, *** p-value < 0.001, **** p-value < 0.0001.

