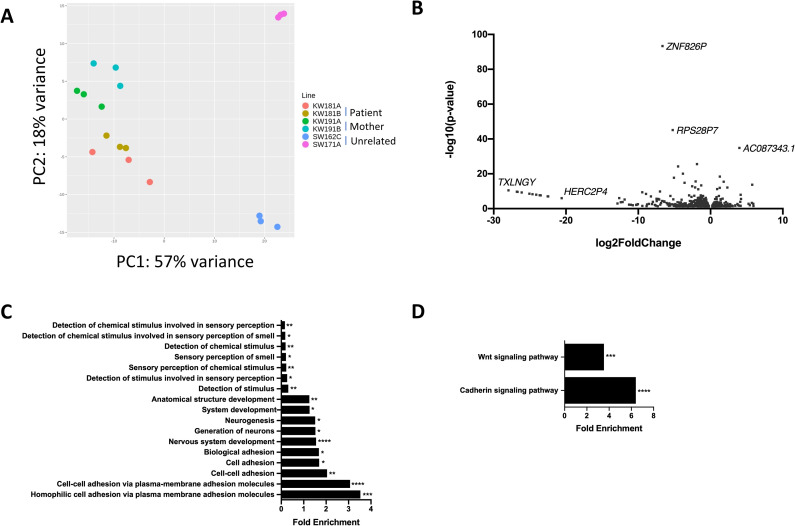
Fig 2. Whole transcriptome RNA-Seq analysis of iPSCs.
RNA-Seq experiments were performed on triplicate samples of RNA isolated from all six iPSC lines (KW181A and KW181B = patient iPSC lines; KW191A and KW191B = mother iPSC lines; SW162C and SW171A = unrelated control lines). For analysis, data from the patient lines was pooled and compared with data pooled from both the mother and unrelated control lines. A) Principal Component Analysis (PCA) for all iPSC lines from RNA-Seq data. B) Volcano plot showing all 1181 significantly differentially expressed genes (DEGs) in patient iPSCs compared to pooled control iPSCs obtained using DESeq2 analysis of RNA-Seq data. Log2foldchange < 0 = significantly upregulated DEGs in patient iPSCs compared to pooled control iPSCs, log2foldchange > 0 = significantly downregulated DEGs in patient iPSCs compared to pooled control iPSCs. C) All enriched Gene Ontology (GO) terms for biological processes associated with DEGs in patient iPSCs compared to pooled control iPSCs, obtained using the PANTHER Overrepresentation Test for Biological Processes. D) Enriched GO terms for biological pathways associated with DEGs in patient iPSCs compared to pooled control iPSCs, obtained using the PANTHER Overrepresentation Test for Biological Pathways. * p-value < 0.05, ** p-value < 0.01, ***p-value < 0.001, **** p-value < 0.0001.

