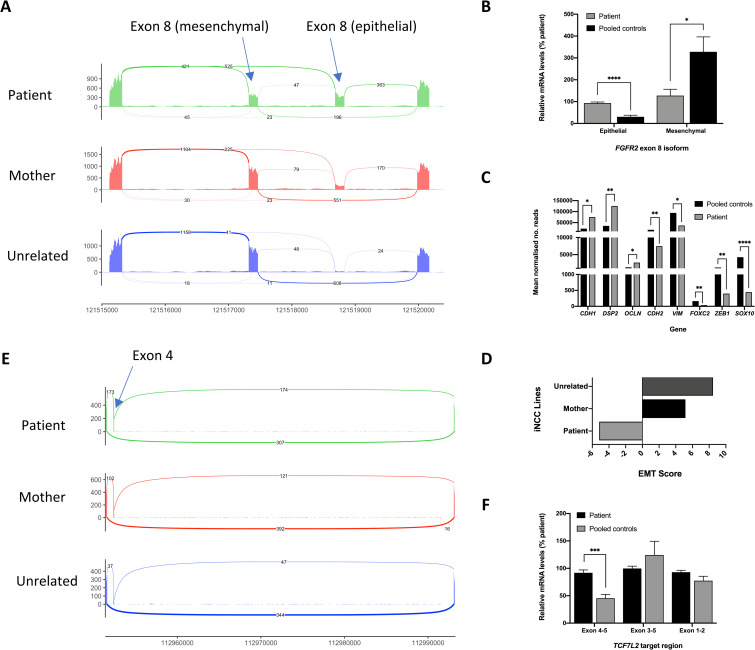
Fig 7. Defects in the EMT in BMKS patient iNCCs.
A) Sashimi plot showing altered inclusion of the epithelial and mesenchymal isoforms of FGFR2 exon 8 in pooled patient, pooled mother and pooled unrelated control iNCCs, derived from rMATS analysis of RNA-Seq data. B) Relative FGFR2 epithelial exon 8 and mesenchymal exon 8 mRNA expression levels for pooled patient iNCCs compared to pooled parent and unrelated control (pooled control) iNCCs, determined using qPCR of cDNA from each cell line. Graphs were obtained using the ΔΔCT method with ACTB as the endogenous reference gene and normalised to the KW181A patient line. n = 3. C) Key marker gene expression levels in iNCCs from RNA-Seq data. Mean normalised read counts for epithelial (CDH1, DSP2, OCLN) and mesenchymal (CDH2, VIM, FOXC2, ZEB1, SOX10) marker genes. D) EMT scores for pooled patient, pooled mother and pooled unrelated iNCCs calculated from RNA-Seq data using the method described by Chae et al., (2018). E) Sashimi plot showing differential splicing of TCF7L2 exon 4 from RNA-Seq data, determined by rMATS analysis. F) Relative TCF7L2 exon 4 inclusion (exon 4–5) compared to overall TCF7L2 expression (exon 3–5 and exon 1–2) in patient iNCCs compared to pooled mother and unrelated control (pooled control) iNCCs, determined using qPCR of cDNA from each cell line. Graphs were obtained using the ΔΔCT method with ACTB as the endogenous reference gene and normalised to the KW181A patient line. n = 3. * p-value < 0.05, ** p-value < 0.01, *** p-value < 0.001, **** p-value < 0.0001.

