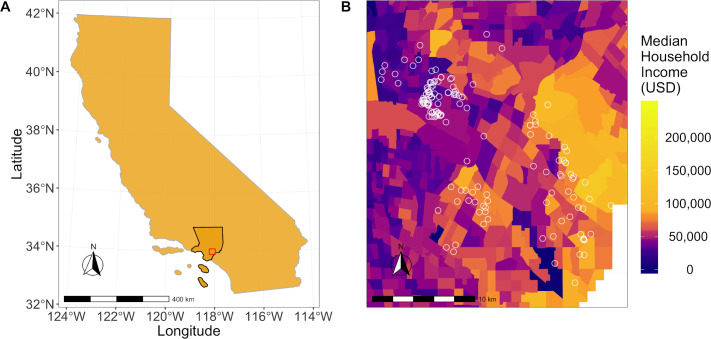
Fig 1. Maps showing the study area and household locations in relation to median household incomes.
(A) Los Angeles County (outlined in black) and the study area (outlined in red). (B) Median household income (USD) by census tract in Los Angeles County, 2010. Geographic boundaries were obtained from the 2019 TIGER/Line shapefiles prepared by the United States Census Bureau, 2019 [56] and income values were mapped using census-tract data from the American Community Survey 5-year estimates (2012–2016) [46]. Houses surveyed for Ae. aegypti are represented by white circles.

