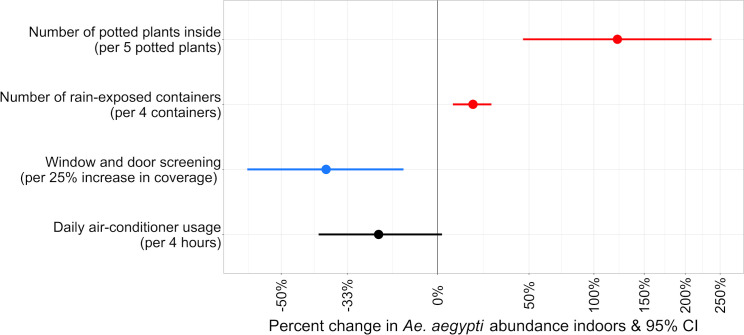
Fig 4. Rate ratios for census-tract and household-level predictors included in final multiple Poisson regression model for Ae. aegypti detections indoors.
For clarity, rate ratios are expressed as a percentage change for each covariate. The model was adjusted for mosquito collector, average daily temperature of the seven days prior to collection, and collection date. Red indicates a risk factor (P < 0.05), blue indicates a protective behavior (P < 0.05), and black indicates a non-significant predictor (P > 0.05) that significantly improved model fit (P < 0.05). X-axis is on the logarithmic scale.

