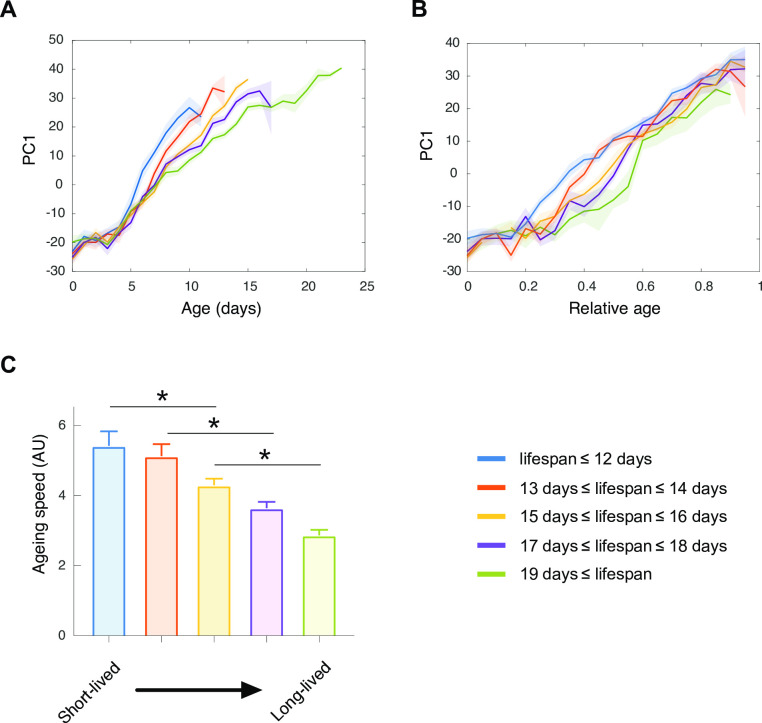
Fig 5. The rate of phenotypic change used as a proxy for the aging rate.
The evolution of individuals along the first principal component (PC1) is displayed over chronological (A) and relative (B) age for 5 groups of longevity. The mean for each group of longevity correspond to the colored lines, the shaded areas indicate the standard errors of the mean. (C) The mean ageing rate for each group of longevity was determined as the mean of the first derivative of PC1, error bars indicate the standard errors of the mean.

