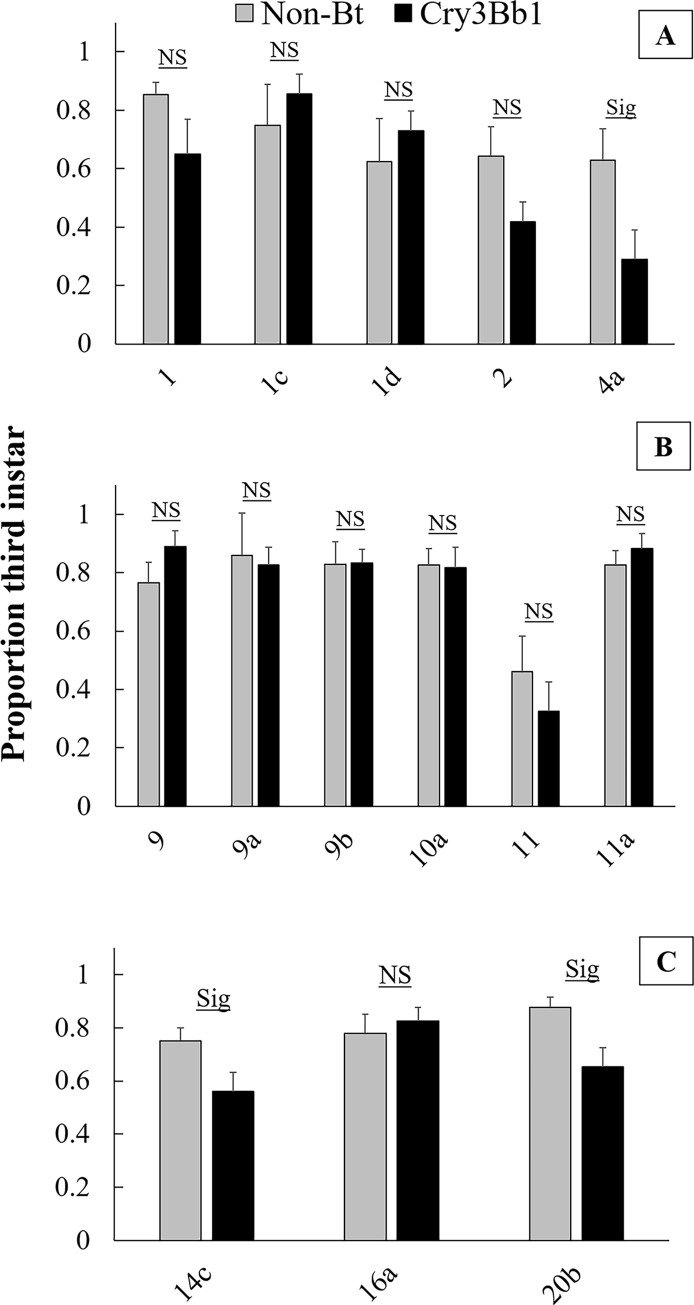
Fig 5. Proportion of third instar larvae in single-plant bioassays on Cry3Bb1 corn and its non-Bt genetic isoline.
A) 2015, B) 2016, and C) 2017. Bars heights represent sample means and error bars are standard error of the mean. Sig. indicates a significant difference in the proportion of third instar larvae between the two corn types within the same population, and NS indicates that no significant difference in the number of third instar larvae was found between the two corn types.

