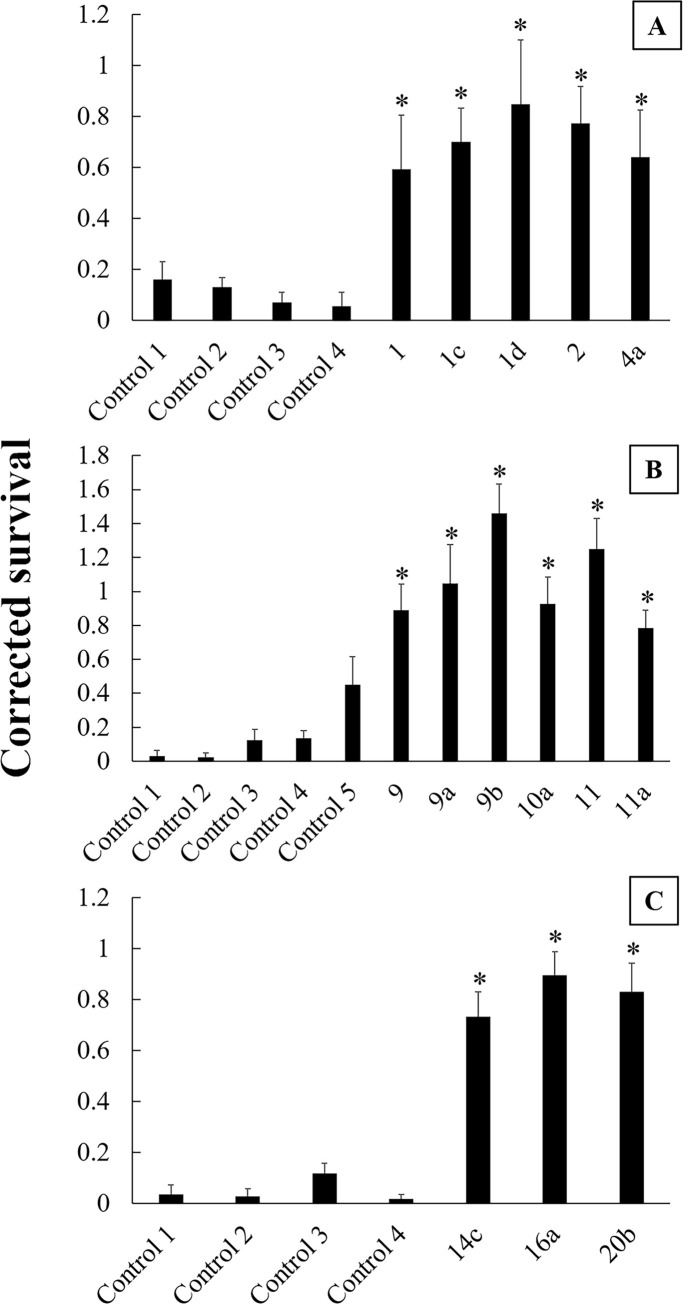
Fig 6. Corrected survival in single-plant bioassays.
Bar heights are means and error bars are standard error of the mean. A) 2015, B) 2016, and C) 2017. Asterisks indicate that corrected survival in the population was significantly higher than the controls in the year the assay was conducted. For 2015, control populations were four diapausing lab strains that had never been exposed to Bt. For 2016 and 2017, control populations were replicates of Control 3 in 2015. Populations with numerals only originated from focal fields, and populations with alphanumeric designation originated from surrounding fields that are associated with the focal field with the same numeral (e.g., population 9a was collected from a field in the local landscape of focal field 9).

