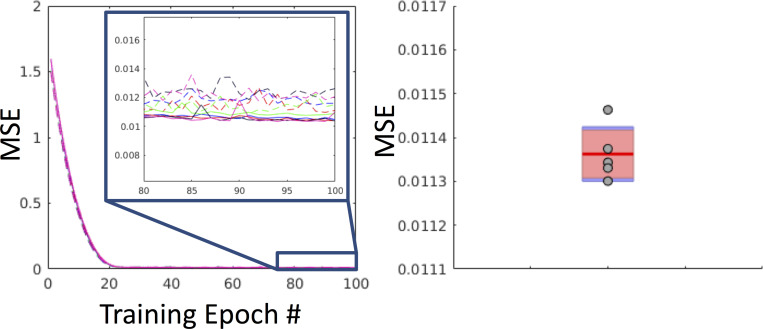
Fig 5. Training, validation, and withheld loss.
Left: Training and validation curves for each fold (5 training loss curves and 5 validation loss curves). The solid lines are the training curves and the dashed lines are the validation curves. Right: Plot of the MSE of the withheld test set (N = 100) for each fold shown as gray dots (5 folds) against a boxplot of the tail-end of the validation curves for each fold. Note that the test loss falls within the same range of the tail-end of the validation curves.

