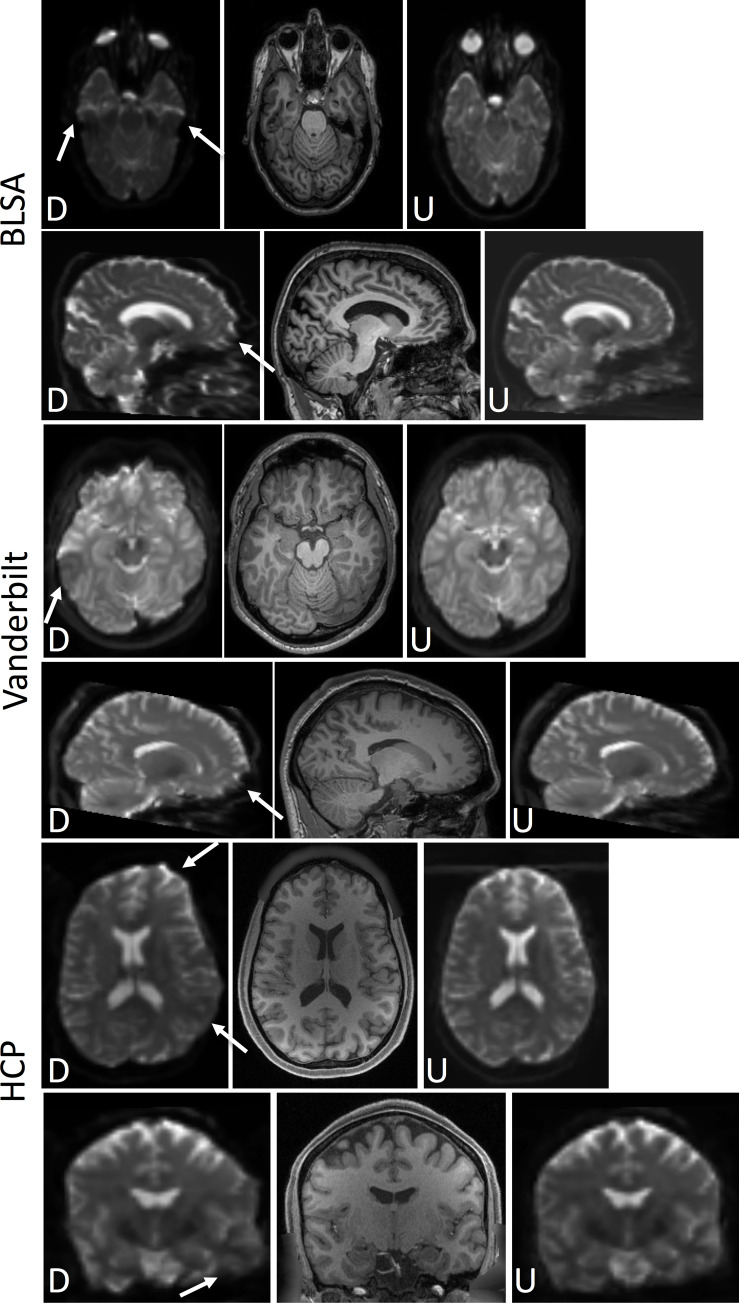
Fig 6. Withheld test set results.
BLSA (top), Vanderbilt (middle), and HCP (bottom) datasets, the distorted (“D”) and undistorted (after applying the proposed pipeline) b0 (“U”) are displayed along with a structurally-undistorted T1 image. This demonstrates qualitatively improved alignment to the subjects’ T1 using the proposed pipeline (i.e., synthesized b0 and topup correction). Arrows highlight areas of observable improvement as described in the text.

