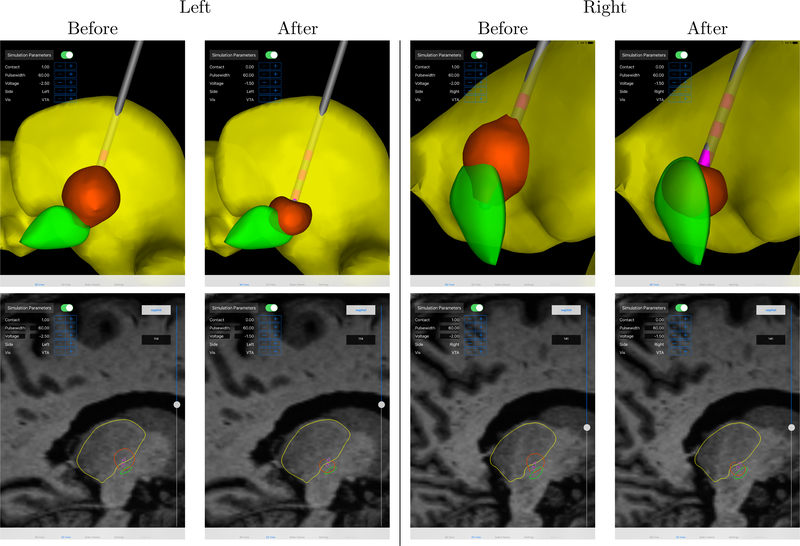
Figure 4.:
Comparison of predicted DBS effect before and after the Duality-assisted programming session. The VTA is shown in orange, the STN in green, and the Thalamus in yellow. The DBS lead contacts are shown in pink and the shafts in gray. Left STN DBS is shown on the left, right STN DBS on the right; top row shows 3d and bottom row shows 2d views.

