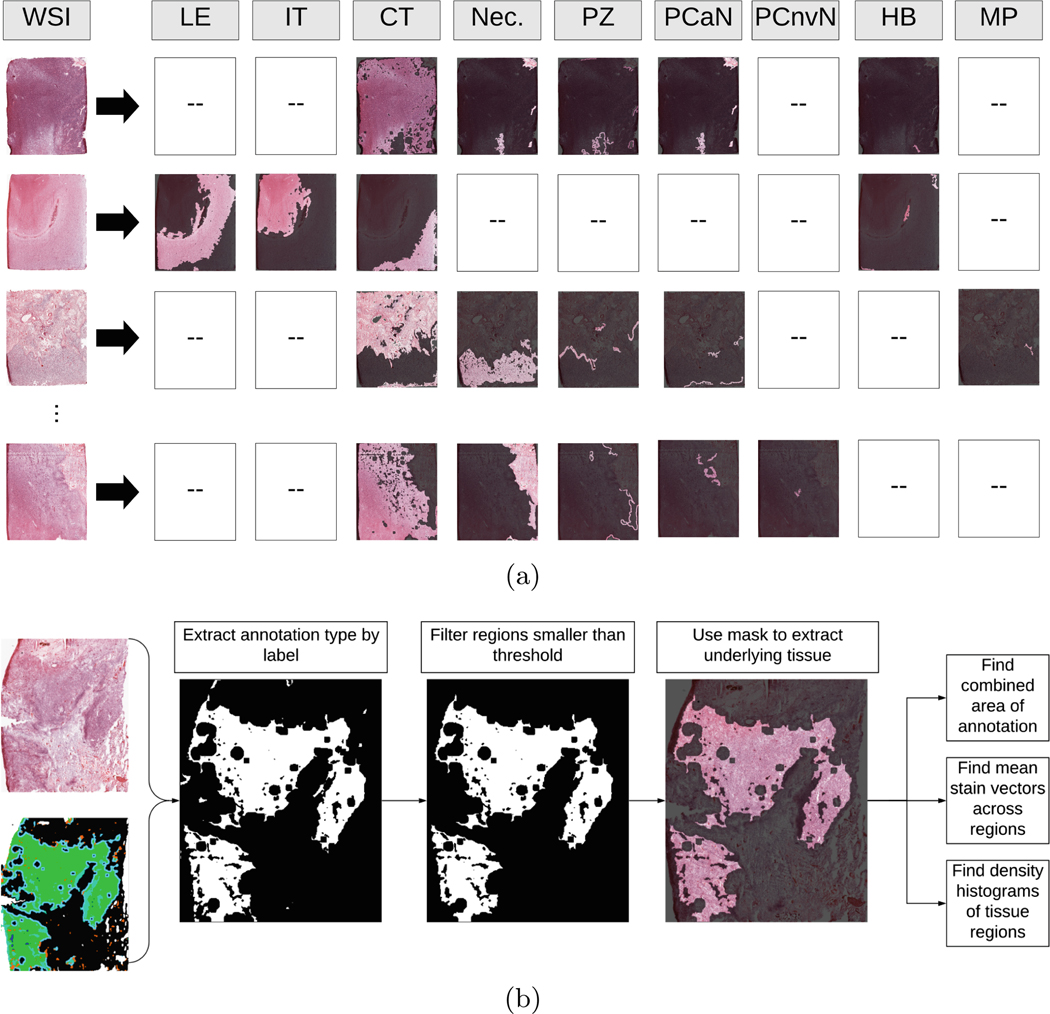
Fig. 3.
(a) Examples of decomposing WSIs into various annotated anatomical regions. The labels correspond to the following respective components: leading edge, infiltrating tumor, cellular tumor, necrosis, perinecrotic zone, pseudopalisading cells around necrosis, pseudopalisading but no visible necrosis, hyperplastic blood, and microvascular proliferation. (b) Overview of the process used to separate and analyze regions from WSIs. First, a slide and a corresponding annotation map were loaded. Then, on a per-annotation basis, a pixel mask was created, and regions smaller than a threshold were removed. Then, each underlying region of tissue was extracted, and broken down into stain vectors and density maps via SNMF encoding [32]. Finally, a histogram was computed for the annotated tissue region. Repeat for each annotation present in the slide.

