
Figure 2.
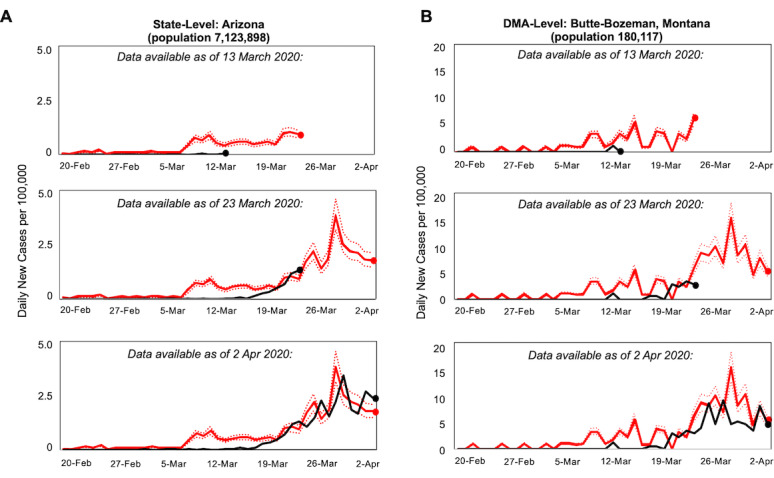
Correlation of query predictions (red) with regional coronavirus disease (COVID-19) case rates (black) at the state and designated market area (DMA) levels, February 20 to April 2, 2020. (A) Comparison of predicted case rates (red) with actual case rates (black) at the state level, with Arizona shown as an example. Dashed lines indicate 95% CIs. (B) Comparison at the DMA level, with the Butte-Bozeman area shown as an example of predictions in a low-population region.