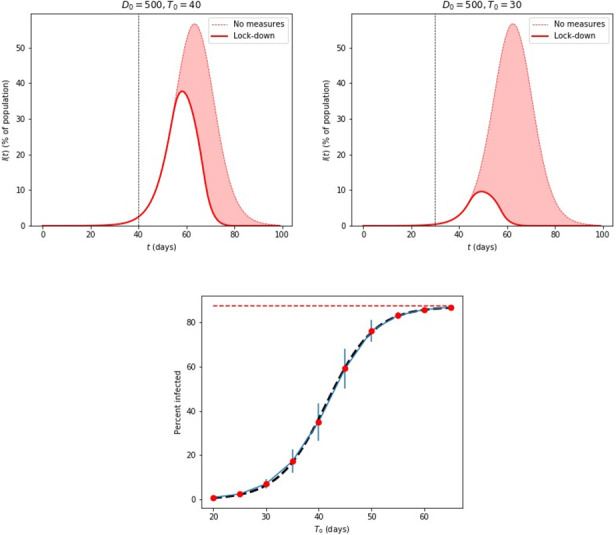
Figure 3.

Top: Epidemic disease simulations of the infected population, I(t), as a percentage of the total population, using 1 million individual agents on a 2D grid, with different lockdown dates, T0, after the initial cases at t=0. The shaded curve in the background corresponds to I(t) with no lockdown measures. For these simulations, β=.25, 1/γ = 14 days, and λ=2.5 days. Bottom: The percent of the total infected population, Rtot(T0) for different values of T0, ranging from 0.93%, for T0=20 days, to 86.7%, for T0=65 days. The error bars represent standard deviations from averaging over 30 samples in each case (for the largest and smallest values, the error bars are too small to be visible). The black dashed curve is the fit from equation (4). The red dashed line represents the value for no lockdown measures, which is 87.4%.
