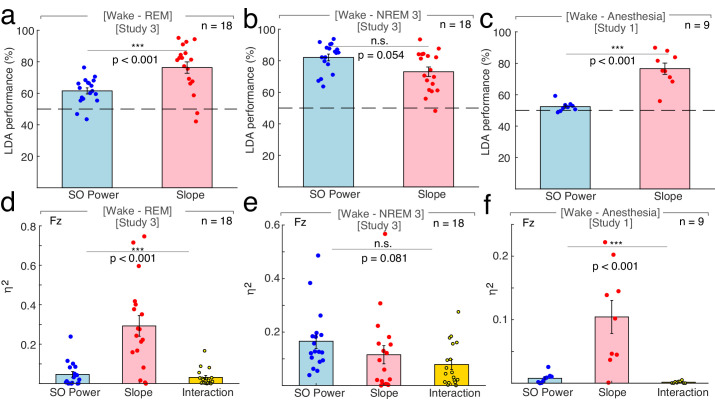
Figure 3. Differentiation of wakefulness from sleep and general anesthesia via Linear Discriminant Analysis (LDA) trained classifier and multivariate general linear modeling (GLM).
All LDA classification performances (panel a – c) were logit-transformed and averaged across channels before comparison. (a) Using the 1/f slope (n = 18; two patients had to be excluded due to insufficient wake trials) resulted in a higher percentage of correct classification of wakefulness and REM compared to slow wave (SO) power (<1.25 Hz; SO: 61.50 ± 1.93% (mean ± SEM), slope: 76.31 ± 3.61%; permutation t-test: p<0.001, observed (obs.) t17 = 3.73, d = 1.25). **p<0.01. Dashed line – chance level at 50% (permutation t-test vs. chance): SO: p<0.001, obs. t17 = 5.51, d = 1.84, slope: p<0.001, obs. t17 = 6.03, d = 2.01). (b) The use of SO power and spectral slope resulted in comparable classification of wakefulness and NREM sleep stage 3 (n = 18; SO: 82.09 ± 2.13%, slope: 73.05 ± 2.97%; permutation t-test: p=0.054, obs. t17 = −1.95, d = −0.72). n.s. – not significant. Dashed line – chance level at 50% (permutation t-tests vs. chance): SO: p<0.001, obs. t17 = 11.23, d = 3.71, slope: p<0.001, obs. t17 = 6.63, d = 2.21). (c) The 1/f slope (n = 9) resulted in a higher classification accuracy of wakefulness and anesthesia with propofol compared to SO power (SO: 52.43 ± 1.04%, slope: 76.56 ± 3.56%; permutation t-test: p<0.001, obs. t8 = 6.10, d = 2.63). ***p<0.001. Dashed line – chance level at 50% (permutation t-test vs. chance): SO: p=0.003, obs. t8 = 2.33, d = 1.10, slope: p<0.001, obs. t8 = 6.15, d = 2.89). All predictors for the multivariate GLM (panel d - f) were z-scored before modeling and calculated on data derived from scalp electrode Fz. (d) Between wakefulness and REM sleep (n = 18; two patients had to be excluded due to insufficient wake trials), the unique explained variance as quantified by eta squared (η2) was significantly different between the 1/f slope, SO power and the interaction between the two (slope: 0.12 ± 0.03, SO: 0.17 ± 0.03, interaction: 0.08 ± 0.02; repeated-measures ANOVA permutation test: p<0.001, F1.16, 19.74 = 19.69). ***p<0.001. (e) Variance between wakefulness and NREM sleep stage 3 (n = 18) was equally well explained by the 1/f slope, SO power and their interaction (slope: 0.12 ± 0.03, SO: 0.17 ± 0.03, interaction: 0.08 ± 0.02; repeated-measures ANOVA permutation test: p=0.081, F1.72, 29.28 = 2.55). n.s. – not significant. f, Out of the total variation between wakefulness and general anesthesia with propofol (n = 9), significantly different proportions could be attributed to the 1/f slope, SO power and their interaction (slope: 0.10 ± 0.03, SO: 0.01 ± 0.003; interaction: 0.002 ± 0.001; repeated-measures ANOVA permutation test: p<0.001, F1.01, 8.09 = 14.61). This effect was mainly driven by the 1/f slope. ***p<0.001.

