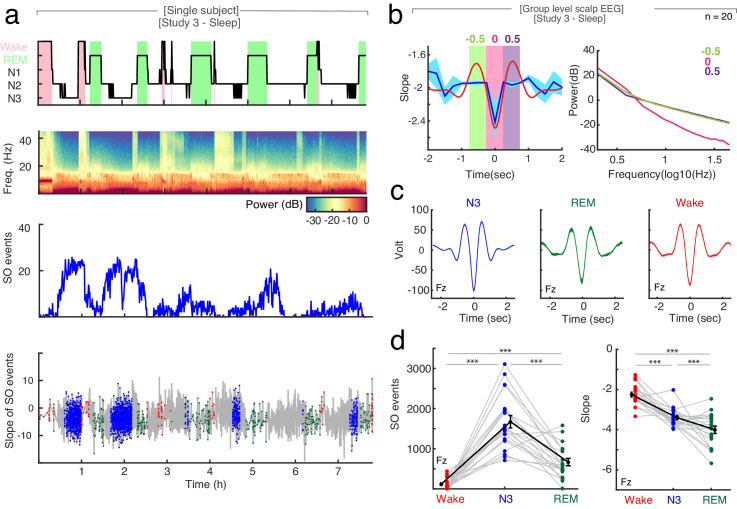
Figure 4. The relationship between spectral slope and slow waves in sleep.
(a) Single subject example: Upper panel: Hypnogram. Wake periods are highlighted in pink, REM periods in light green. Upper middle panel: Multitapered spectrogram of electrode Fz. Lower middle panel: Number of slow wave (SO) events during 30 s segments of sleep in electrode Fz. Note the decreasing number of SO events during the course of the night. Lower panel: Spectral slope of SO events occurring in N3 (blue), wakefulness (red) and REM sleep (green) in electrode Fz. Background: Time-resolved slope of electrode Fz in light gray. (b) Right panel: Average spectral slope changes over the time course of all slow waves in scalp EEG (n = 20) during sleep (blue; mean ± SEM); superimposed in red is the average slow wave of all subjects. Highlighted are the following 0.5 s time windows relative to the slow wave trough: −750 to −250 (center −0.5 s; green), −250 to 250 (center 0 s; pink) and 250 to 750 ms (center 0.5 s; purple). Left panel: Power spectra in log-log space within specified time windows during the slow wave: −750 to −250 (center: −0.5 s; green), −250 to 250 (center: 0 s; pink) and 250 to 750 ms (center: 0.5 s; purple). Note the steep power decrease during the trough of the slow wave (pink). (c) Group level (n = 20) average waveforms in electrode Fz during N3 (blue), REM sleep (green) and wakefulness (red; mean ± SEM). (d) Left: Slow wave events per minute in wakefulness (red), N3 (blue) and REM (green) in scalp EEG channel FZ (n = 20). In black mean ± SEM. Permutation t-tests: ***p<0.001. Right: Slope of slow wave events on the group level (n = 20; averaged across all 19 EEG electrodes) in wakefulness (red), N3 (blue) and REM sleep (green). Mean ± SEM in black. Permutation t-tests: ***p<0.001.

