
Author response image 1. Uni- and multivariate discrimination of wakefulness and REM sleep using the spectral slope and slow oscillation power.
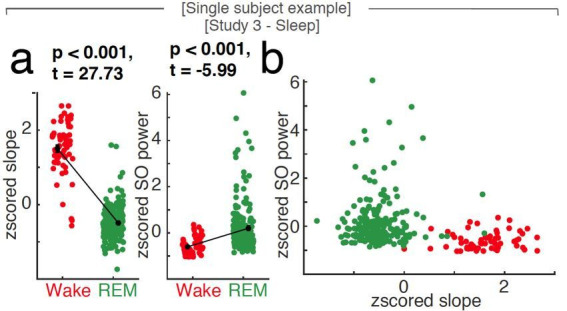
Single subject example at scalp EEG electrode Fz. a, While both 1/f slope (z-scored; left panel) and slow oscillation power (SO, < 1.25 Hz; z-scored; right panel) are able to differentiate wakefulness (red) from REM sleep (green; black: mean ± SEM) in a univariate comparison, the 1/f slope provides most of the discriminative power in a multivariate space as seen in panel b (SO power vs. 1/f slope; both z-scored). Note that the states (red – wakefulness; green – REM sleep) are clearly discernible based on the first feature plotted on the x-axis (the spectral slope) while taking SO power (on the y-axis) into account, does not contribute independent information.