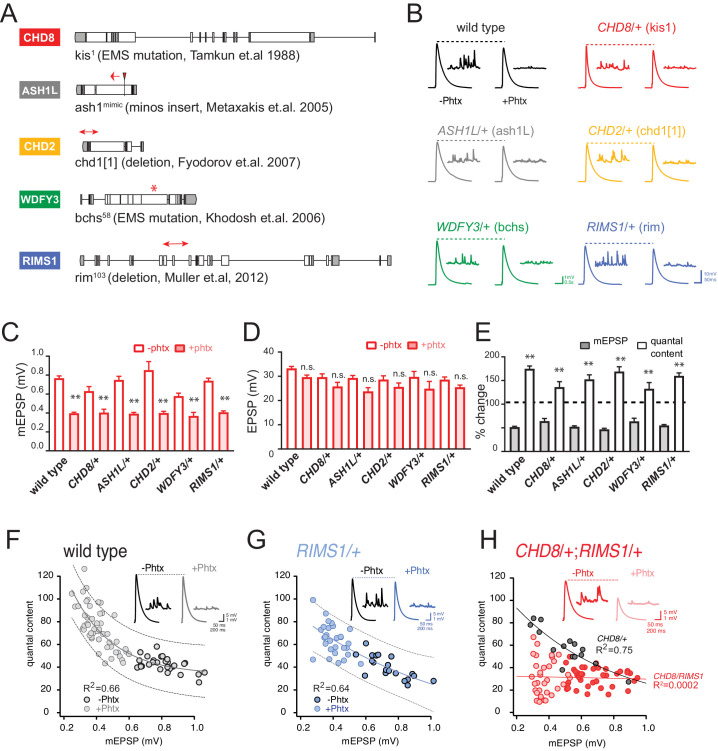
Figure 1. Heterozygous ASD gene mutations do not affect baseline transmission or PHP.
(A) Schematic of the Drosophila locus for CHD8, ASH1L, CHD2, WDFY3 and RIMS1 with gene disruptions indicated. (B) Representative EPSP and mEPSP traces for indicated genotypes (+ / - PhTx for each genotype, left traces and right traces respectively) (C–D) Quantification of mEPSP amplitude (C) and EPSP amplitude (D) in the absence and presence of PhTx (open and filled bars respectively). (E) The percent change of mEPSP and quantal content as indicated, comparing the presence and absence of PhTx for each genotype with Student’s t-test (two tail), *p<0.05, **p<0.01. Sample sizes for data reported (C–E) are as follows (n reported for each genotype -/+ PhTx): wild type: n = 36/47; CHD8/+: n = 7/8; ASH1L/+: n = 15/25; WDFY3/+: n = 8/7; CHD2/+: n = 8/19; RIMS1/+: n = 20/30. (F–H) Scatter plots of quantal content (y axis) versus mEPSP amplitude (x axis) for wild type (left), RIMS1/+ mutant (middle) and the CHD8/+; RIMS1/+ double heterozygous mutant. Each symbol represents an individual muscle recording. Inset: representative traces (+ / - PhTx). Exponential data fit (black line, R2-value inset, calculated based on a linear fit). Dashed lines encompass 95% of all data (absent in (H) for clarity). Below each graph (F–H), boxes display percent PHP (+ / - PhTx for each genotype), statistical values compared to baseline (H).


