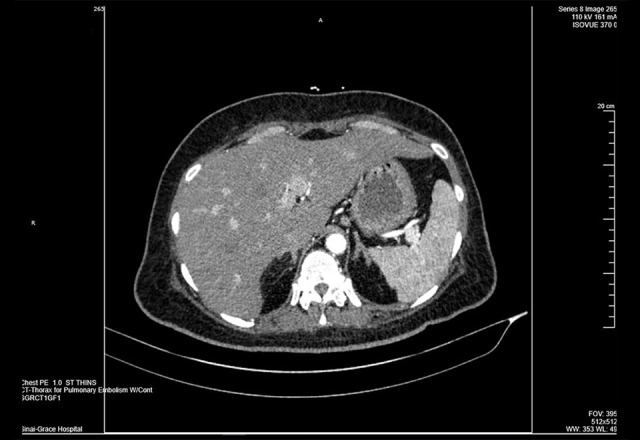
Figure 3.

Computed tomography displays spleen prominent in size and shows few small hypoattenuation areas peripherally and its inferior region highly likely related to focal infarcts. The liver is slightly large and shows focal hypoattenuation anterior–inferior left liver medial section near the fissure compatible with focal fat infiltration.
