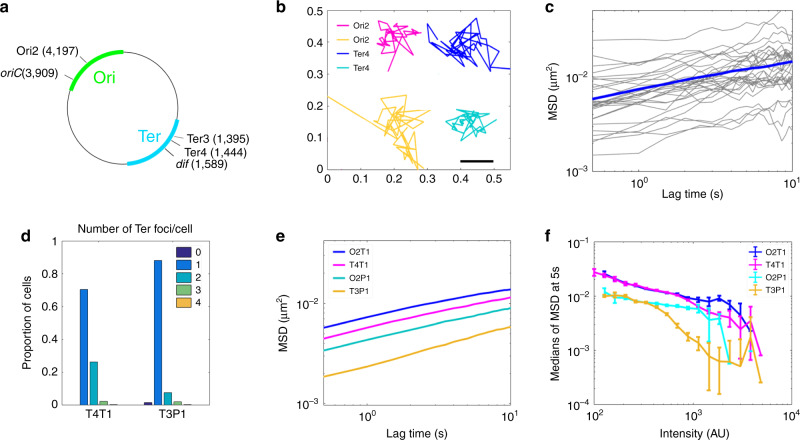
Fig. 1. The type of visualisation system affects the mobility of chromosomal loci.
a Scheme of E. coli chromosome showing two macrodomains, the origin of replication oriC and the site-specific recombination site dif, plus the loci where parS sites have been inserted, called Ori2, Ter3 and Ter4. Positions are indicated in Mbp. b Examples of tracks for Ori2 and Ter4 loci; 2 fps for 20 s, parB-pMT1 system. c Example of 30 MSD from Ter4 (parB-pMT1) locus as a function of lagtime (grey lines), with the median for all MSD of this experiment (n = 1600) shown in blue. d Number of Ter foci per cell (dark blue, cells with no focus; orange, cells with four foci), with ParB-P1 (T3P1) or parB-pMT1 (T4T1). Y axis represents the proportion of cells with that number of foci compared to the total number of cells. e Medians of MSDs as a function of lagtime for Ori2-ParB-P1 (O2P1), Ori2-ParB-pMT1 (O2T1), Ter3-ParB-P1 (T3P1) and Ter4-ParB-pMT1 (T4T1). f Medians of MSD of ParB-P1 and ParB-pMT1 foci at 5 s as a function of intensity of the foci. Error bars show the SEM. For each intensity bin, n = 0, 21, 109, 542, 1512, 3129, 3915, 2876, 1542, 509, 138, 37, 13, 3, 3, 1, 0, 0, 0, 0 foci for O2T1; n = 2, 9, 30, 115, 360, 878, 1399, 1769, 1851, 1635, 1173, 602, 249, 57, 14, 6, 1, 0, 0, 0 for T4T1; n = 0, 4, 26, 125, 363, 665, 830, 638, 372, 152, 36, 13, 4, 1, 0, 1, 0, 0, 0, 0 for O2P1 and n = 0, 3, 20, 84, 231, 395, 532, 514, 438, 317, 216, 88, 71, 26, 10, 2, 1, 0, 0, 0 for T3P1. Source data are provided as a Source Data file.

