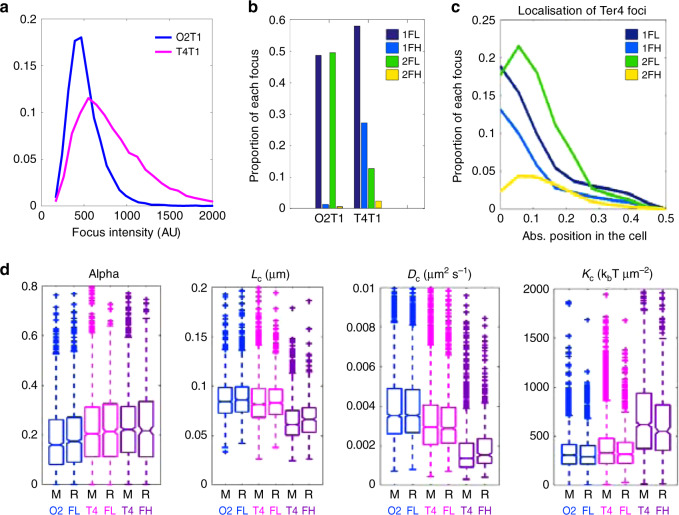
Fig. 2. The high intensity Ter4 foci display a slower dynamic.
a Distribution of intensity of Ori2 and Ter4 parS-pMT1 foci. b Proportion of each type of focus in Ori2 and Ter4 strains. 1FL: single, low intensity focus in the cell; 1FH: single, high intensity focus in the cell; 2FL: low intensity focus detected in a cell with two foci; 2FH: high intensity focus detected in a cell with two foci. The numbers of foci of each type are indicated in Supplementary Data 1. c Proportion of Ter4 foci as a function of their position in the cell. Zero is mid-cell, while 0.5 is a cell pole. d The four parameters α, Lc, Dc and Kc were calculated for Ori2 and Ter4 foci, which were divided first in low (FL) or high intensity (FH) foci, then further in foci localised at mid-cell (M, 0–0.16) or away from mid-cell (R, 0.17–0.5). Ori2 1FL (blue, n = 1411 for M, n = 1889 for R), Ter4 1FL (pink, n = 2744 for M, n = 1064 for R) and Ter4 1FH (purple, n = 1374 for M, n = 412 for R) are shown. The number of 1FH for Ori2 is too low (n = 88) to give significant results and is therefore not plotted here. Box plots show the median of the distribution, the 25th and 75th percentiles of the samples (respectively the bottom and top of the box), the lowest and top values within a range of 1.5 times the interquartile range (dotted lines), and outliers of these as crosses. The notches display the variability of the median; non-overlapping notches between samples indicate different value of the medians at a 5% significance level. Source data are provided as a Source Data file.

