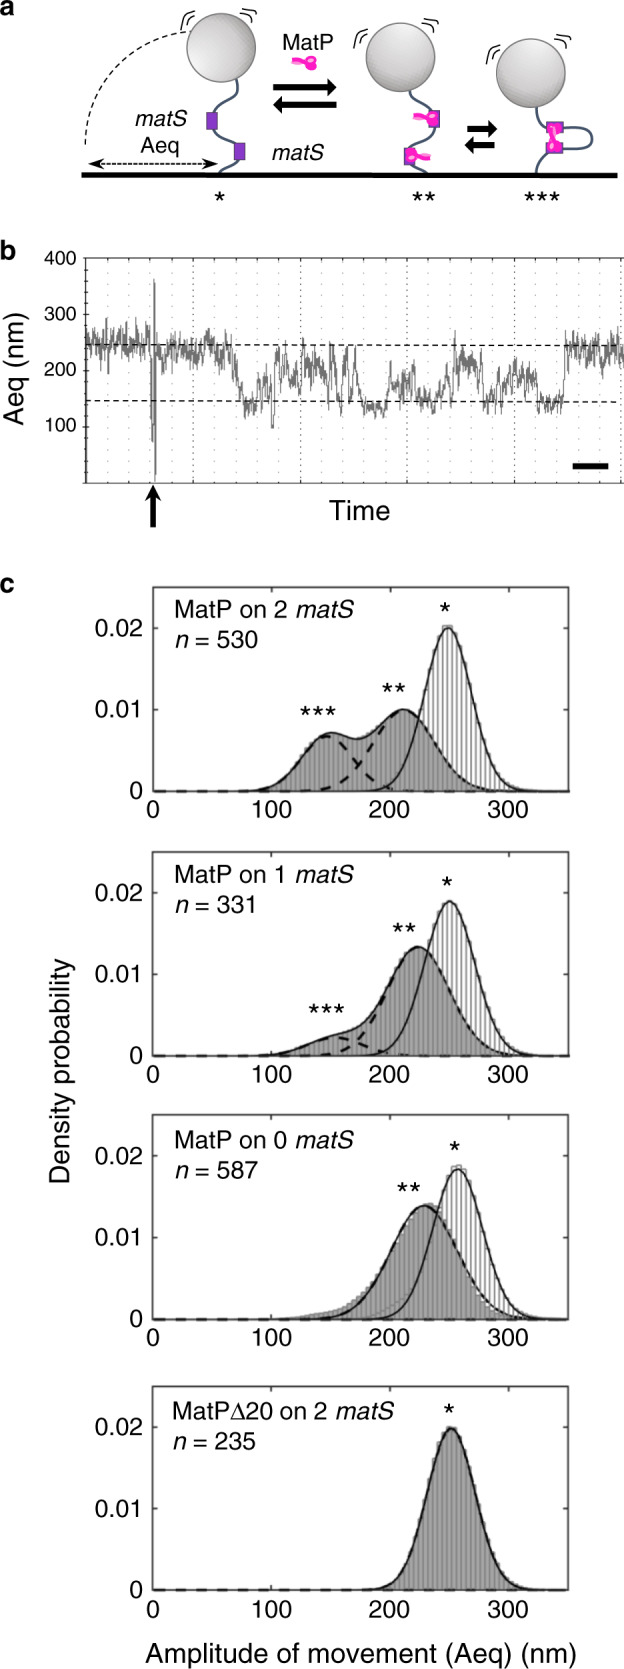
Fig. 6. MatP can loop DNA.

a Scheme of the TPM set-up. A glass coverslip is coated with PEG and neutravidin. A DNA molecule is attached to that surface by a biotin bound to one of its 5′ end. A latex bead coated with anti-digoxigenin is bound to the other extremity of the DNA molecule by the presence of digoxigenin on this 5′ end. The amplitude of the Brownian motion of the bead (Aeq) depends on the size of the DNA molecule that tethers the bead to the glass surface (for details see text and “Methods”). Right: if MatP joins the 2 matS sites together, the Aeq decreases. b Example of a track following a bead tethered to a 2-matS DNA as a function of time. The dotted lines indicate the expected Aeq for a naked DNA (top) or looped DNA (bottom). MatP is added after 2 min (arrow) and the bead tracked for another 13 min. Time scale is 1 min (bar). c Probability distributions of Aeq, before protein injection (light grey histogram), or during the 5 min following the injection (dark grey histograms). The type of DNA (0–2 matS), the type of MatP (wt or Δ20) and the number of tracks obtained for each condition are indicated on the graphs. MatP: *population centred on (mean ± SD, in nm): 248 ± 19; 250 ± 21 and 257 ± 21 for the DNA containing 2, 1 and no matS site, respectively. **population centred on (mean ± SD, in nm): 211 ± 25, 224 ± 26 and 229 ± 28 for the DNA containing 2, 1 and no matS site, respectively. ***population centred on (mean ± SD, in nm): 147 ± 22 and 153 ± 23 for the DNA containing 2 and 1 matS site, respectively. MatPΔ20: *population centred on (mean ± SD): 252 ± 20 nm. Source data are provided as a Source Data file.
