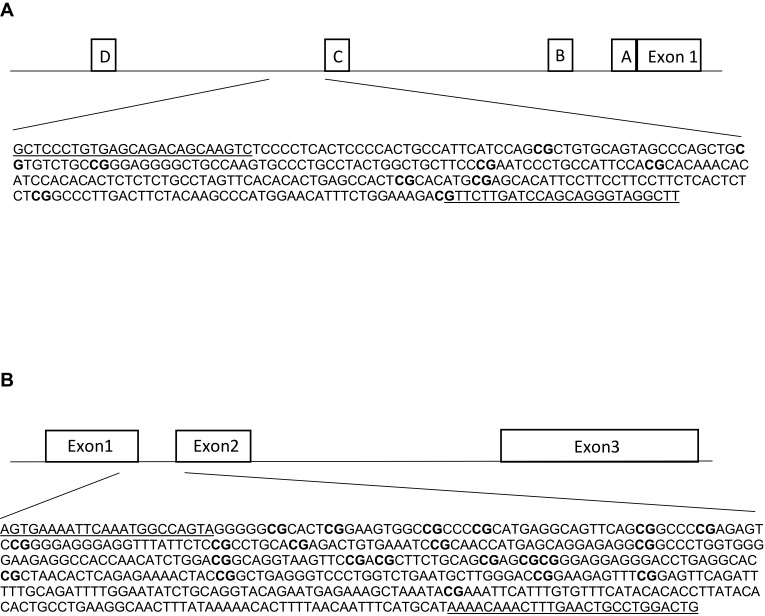
Figure 1.
Schematic figures of ESR1 (A) and GPER (B) promoter regions. (A) The DNA sequence of ESR1, chr6: 151805523–151805822, is located in a CpG island shore of promoter C, and it has been described as an enhancer (ID GH06J151804) of promoter A.44 This region has been reported in humans and rats by Champagne et al, 2006,23 Gardini et al, 2020,35 Ianov et al, 2017,46 and Tsuboi et al, 2017.44 (B) The DNA sequence of GPER, chr7:1087059–1087533 is located in a CpG island across exons 1 and 2. This region has been assessed in Weissenborn et al, 2017.45 White boxes represent exons or promoter regions. Underlined sequences correspond to the primers position. Bold “CG” correspond to the Interrogated CpGs.

