Figure 2.
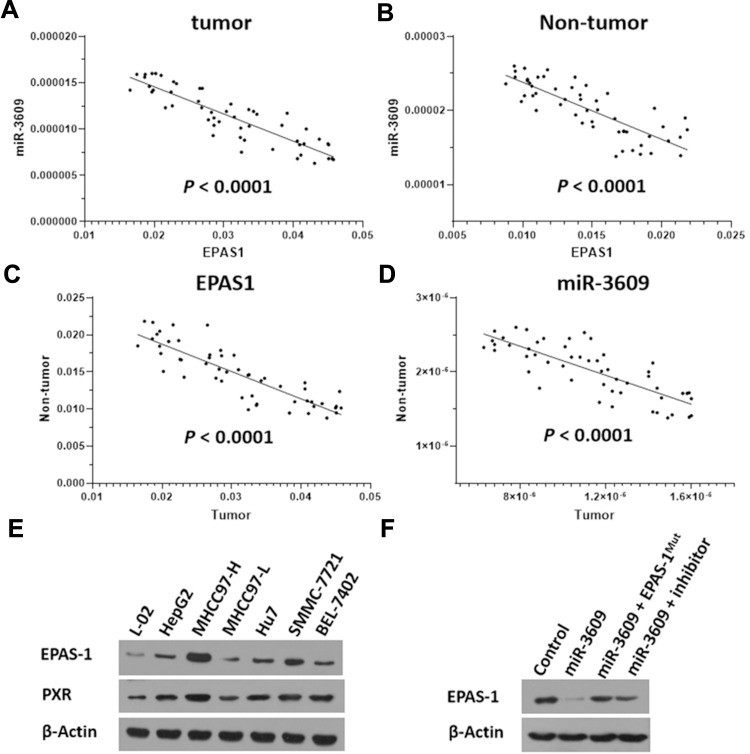
Relationship between the expression of miR-3609 and EPAS-1 in HCC clinical specimens. The expression of miR-3609 and EPAS-1 was examined in the paired tumor/non-tumor clinical specimens. The relationship between the expression of EPAS-1 and miR-3609 in HCC clinical specimens (A) and the paired non-tumor tissues (B) is shown as scatter images. The abscissa represents the expression level of EPAS-1 in the same tissue; the ordinate is the expression level of miR-3609 in the same tissue. The relationship between EPAS-1 (C) and miR-3609 (D) in paired HCC clinical specimens and the paired non-tumor tissues is shown as scatter images. The abscissa represents the expression level of EPAS-1 or miR-3609 in paired specimens (HCC clinical specimens); the ordinate is the expression of EPAS-1 or miR-3609 in paired specimens (the non-tumor specimens). (E) The endogenous expression of EPAS-1 in hepatic cell lines was examined through a Western blot experiment. (F) MHCC97-H cells, which were transfected with the control, miR-3609, miR-3609 + EPAS-1Mut, or miR-3609 + inhibitor, were harvested for Western blot. β-Actin was used as the loading control.

