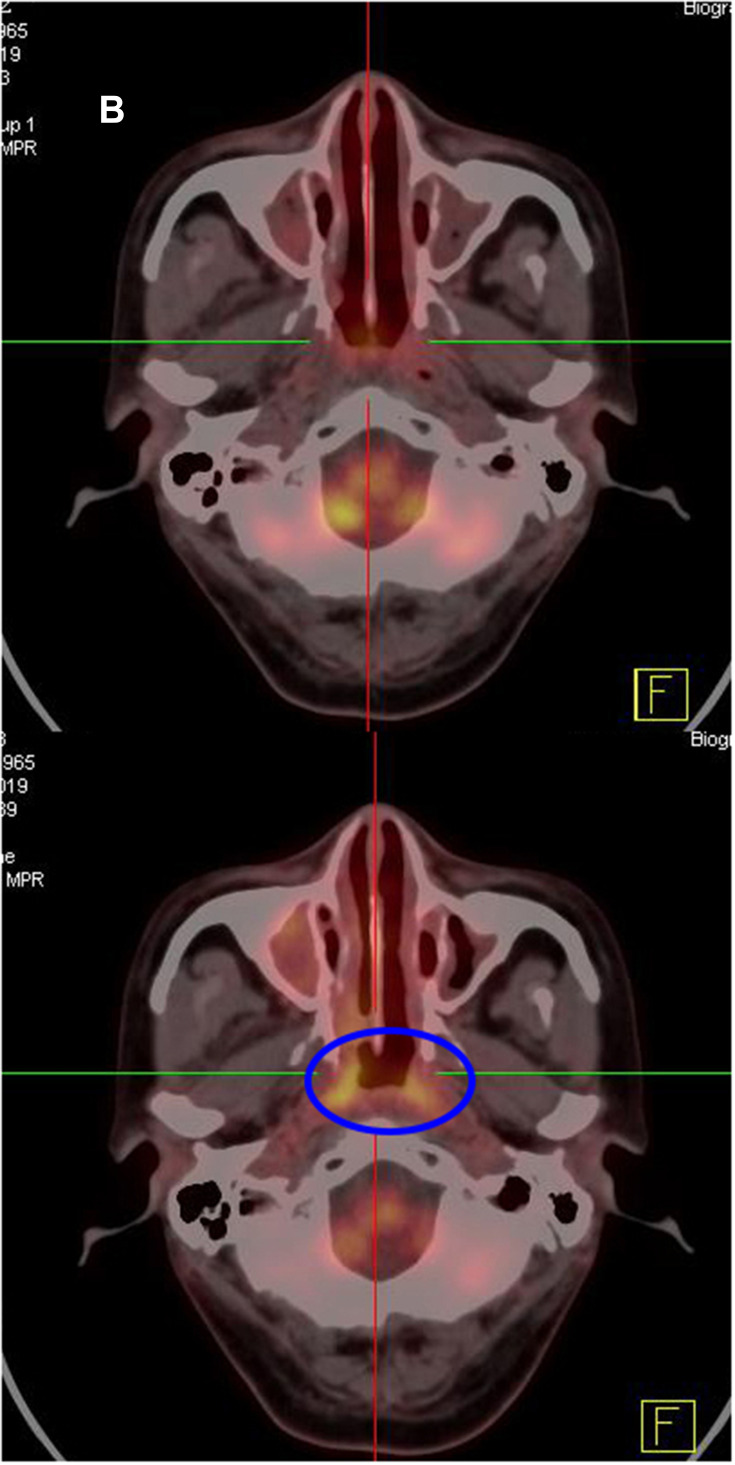
Figure 1.
Comparison of PET-CT images before (July 2019) and after (November 2019) the PCET treatment in patient 1. (A) The value of standardized uptake value (SUV) of the mass (it can be seen in the blue coil) in the right nasal cavity was 5.0 in July 2019. In the upper part of the figure, we can see that the mass of the right nasal cavity was gone, and the SUV value of nasal mucosa reduced to 3.0 after 4 cycles of treatment. (B) The SUV value of the nasopharynx (it can be seen in the blue coil) was 25.2 in July 2019 before the PCET treatment. In the upper part of the figure, we can see that the nasopharyngeal metabolic value decreased significantly (SUV= 5.0) in November 2019. The inflammation of the nasal cavity and sinuses had also improved obviously in November 2019.

