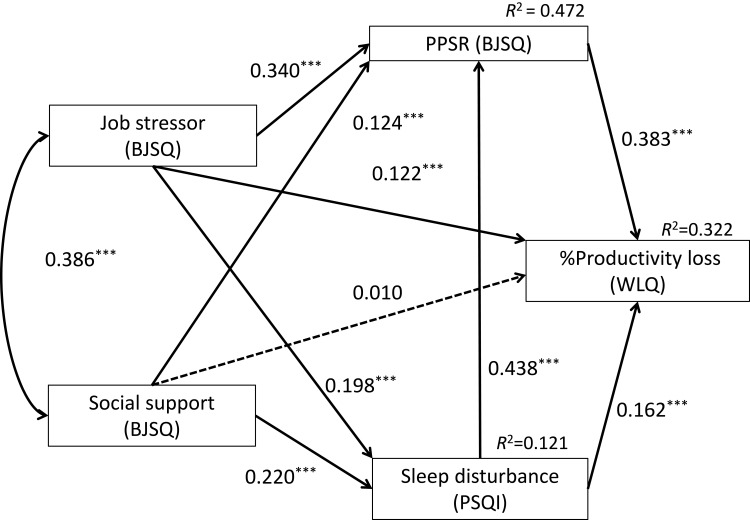
Figure 1.
Results of covariance structure analysis using a path model, with the scores of job stressors, psychological and physical stress response (PPSR), and social support of the Brief Job Stress Questionnaire (BJSQ), the score of the Pittsburgh Sleep Quality Index (PSQI) indicating sleep disturbance, and the score of the percent productivity loss of the Work Limitation Questionnaire (WLQ) indicating presenteeism in 2899 adult workers are shown. Rectangles indicate the observed variables. Arrows with solid lines represent the statistically significant paths, and broken lines show the nonsignificant paths. The numbers beside the arrows show the direct standardized path coefficients. Indirect effects through the variables are explained in the Results section. *** p < 0.001.

