
Figure 1.
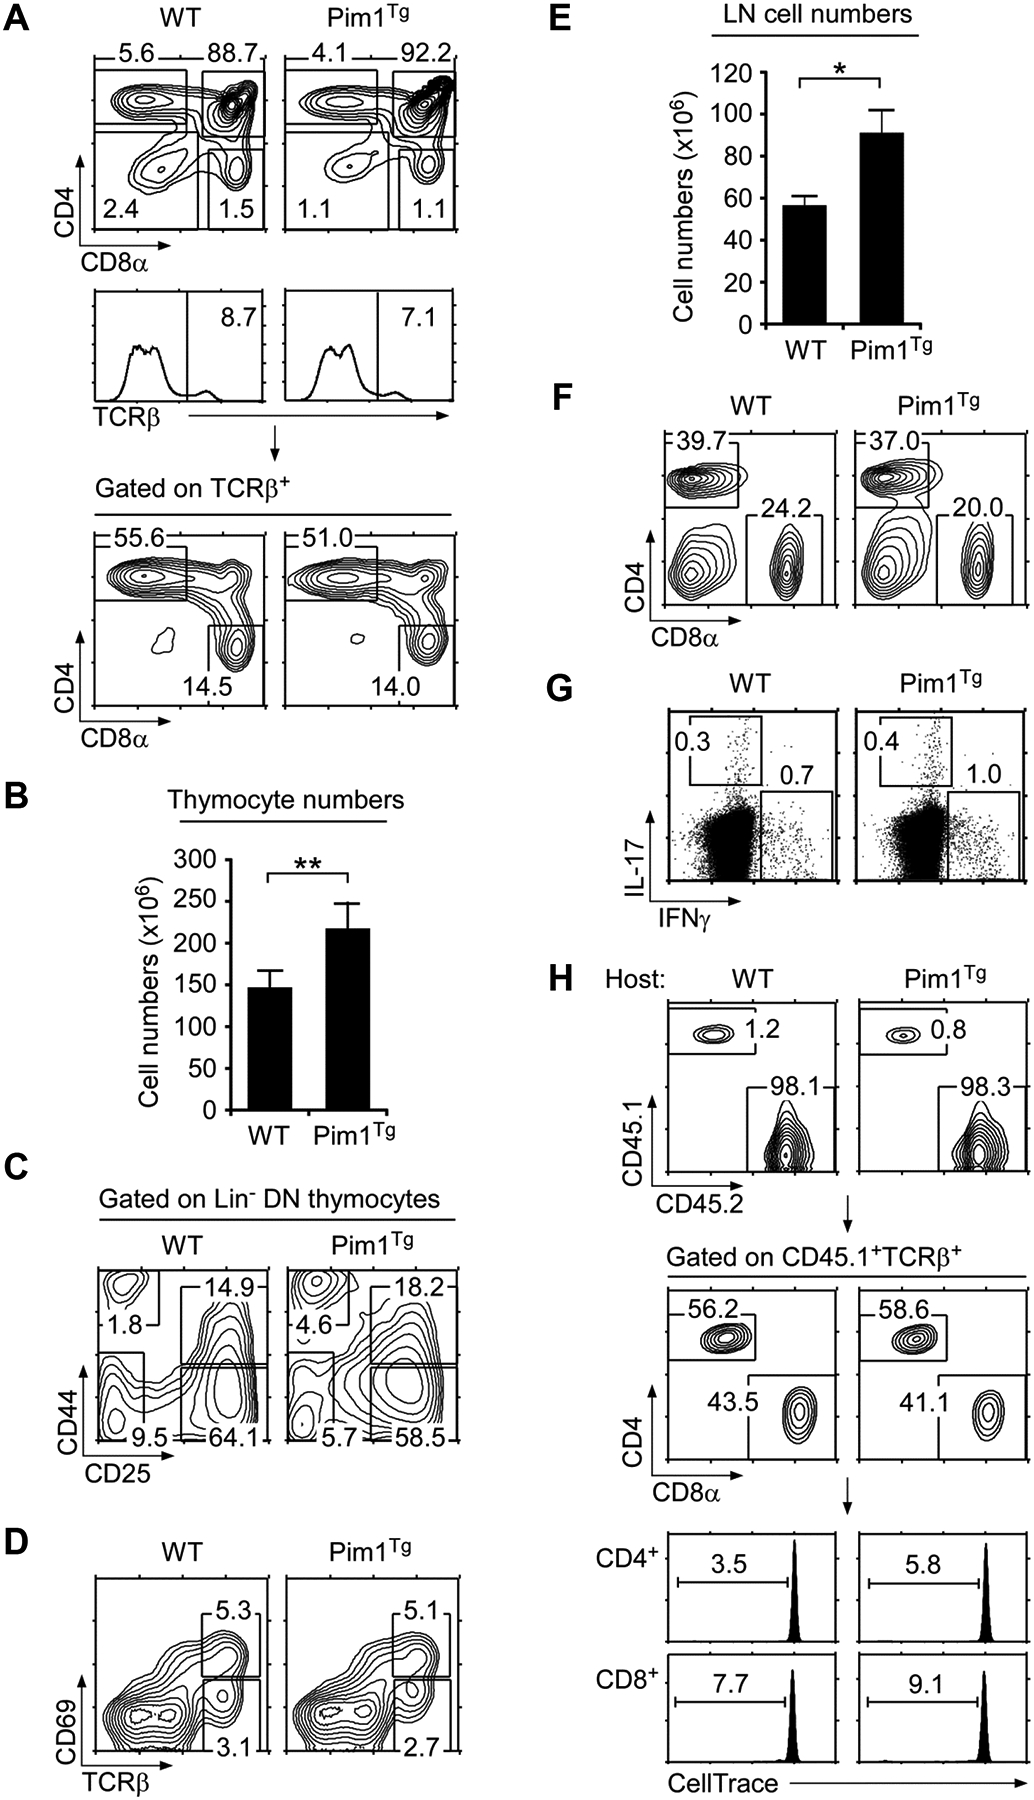
(A) Thymocyte profiles of WT and Pim1Tg mice. Contour plots show CD4/CD8 profiles of total (top) and TCRβ+ gated thymocytes (bottom). Gating strategy is shown in histograms (middle). Numbers indicate percentages of gated cells. Data shown are representative of eight independent experiments.
(B) Thymocyte numbers in WT and Pim1Tg mice. Data are shown as mean +/− SEM of 11 WT and 8 Pim1Tg mice.
(C) DN thymocyte differentiation. Lineage marker negative (Lin−) DN thymocytes were assessed for DN1–DN4 differentiation by CD44/CD25 expression.
(D) Thymocyte selection in WT and Pim1Tg mice. Whole thymocytes were stained for CD69 and TCRβ expression. Data shown are representative of eight independent experiments.
(E) LN cell numbers of WT and Pim1Tg mice. Data are shown as mean +/− SEM of 8 WT and 7 Pim1Tg mice.
(F) LN cell profiles of WT and Pim1Tg mice. CD4/CD8 contour plots are representative of eight independent experiments.
(G) Cytokine expression in CD4+ LN T-cells. Freshly isolated CD4+ T-cells were stimulated for 3 hours with PMA + ionomycin in the presence of brefeldin A and assessed for intracellular IL-17 and IFN-γ expression. Data are representative of three independent experiments.
(H) T-cell adoptive transfer into WT or Pim1Tg hosts. WT (CD45.1) T-cells labeled with the CFSE analog “CellTrace™ Violet” were tail vein injected and analyzed 6 days later from LN of WT (CD45.2) or Pim1Tg (CD45.2) host mice. Data shown are representative of two experiments. (B, D) Data shown are from one experiment representative of eight experiments performed. *p<0.05, **p<0.01, two-tailed Student’s t test.