
Figure 4.
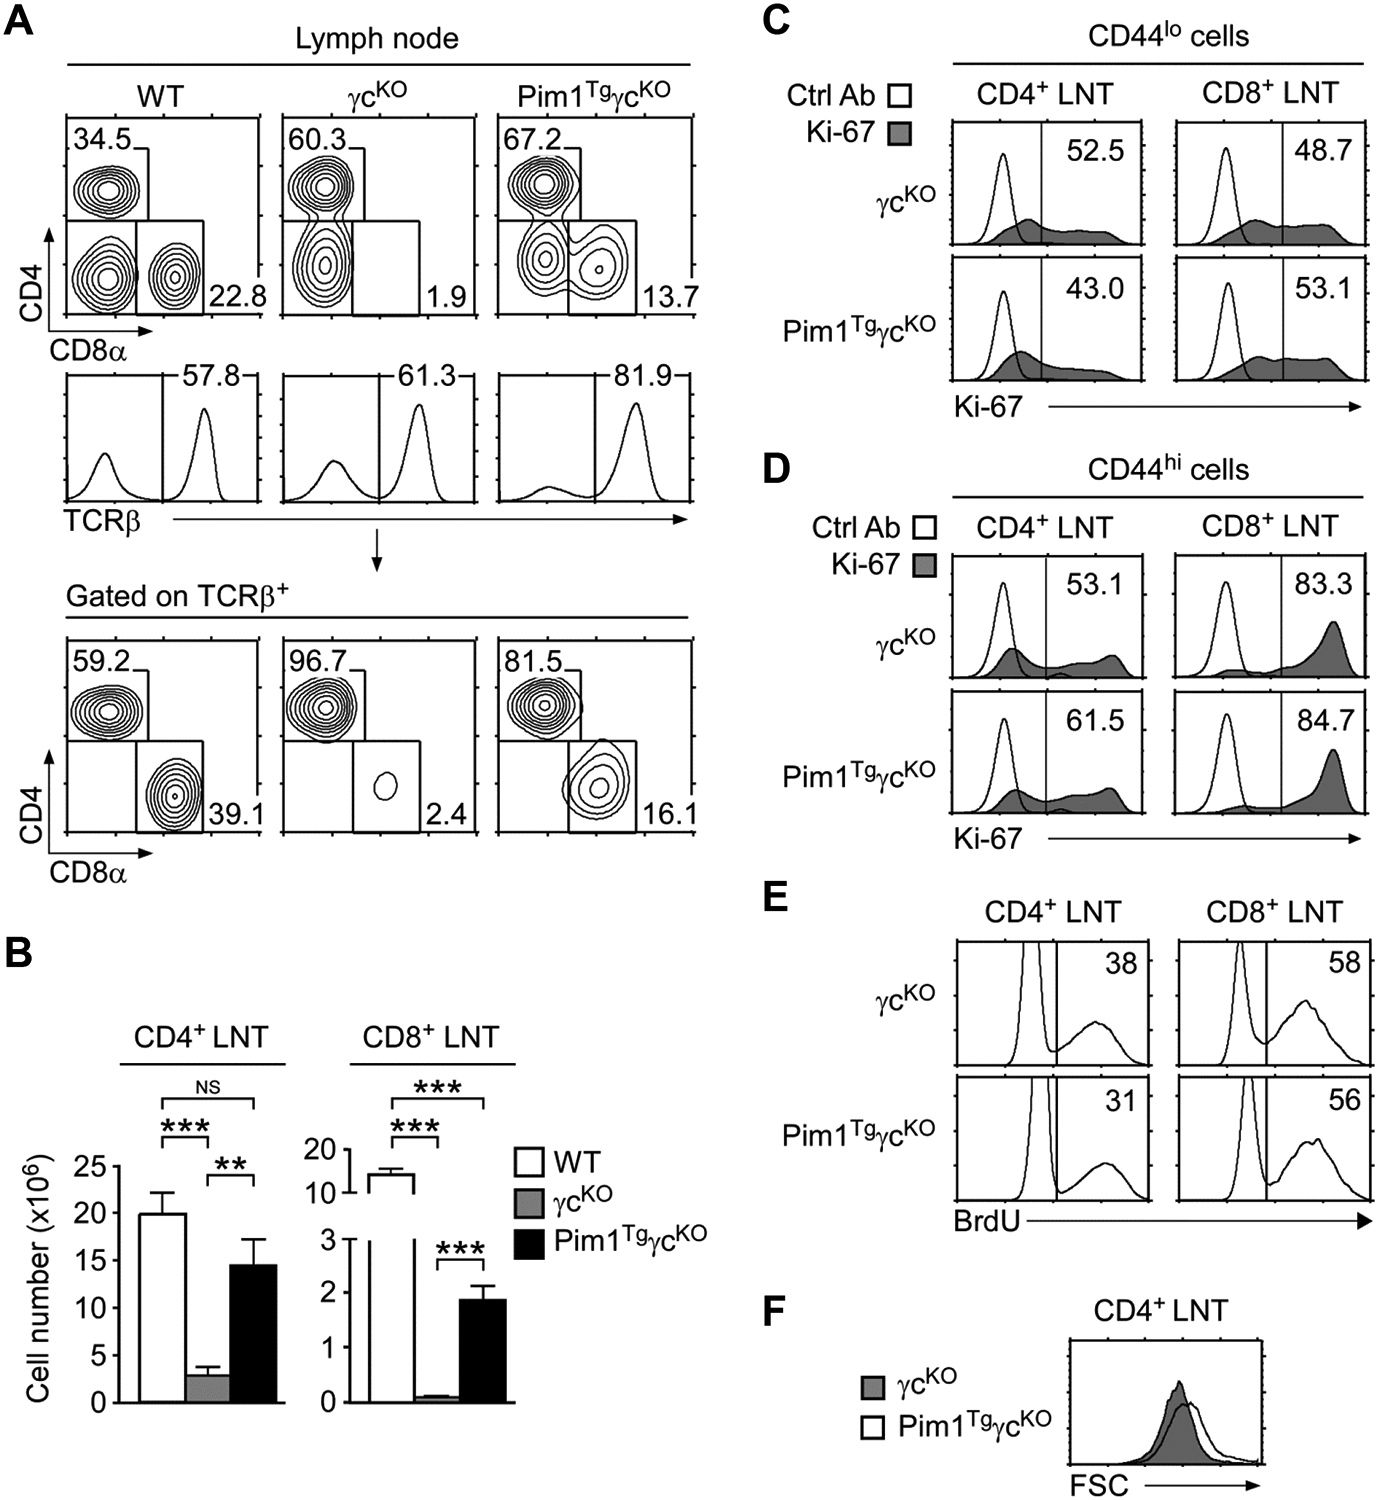
(A) LN cell profiles of WT, γcKO, and Pim1TgγcKO mice. Contour plots show CD4/CD8 profiles of total LN cells (top) and TCRβ+ LN cells (bottom). Gating strategy and percentages of TCRβ+ cells are shown in histograms (middle). Data shown are representative of seven independent experiments.
(B) CD4+ and CD8+ LN T-cell numbers. Data are shown as mean +/− SEM of 11 WT, 6 γcKO, and 8 Pim1TgγcKO mice, and are pooled from seven experiments performed. *p<0.05, **p<0.01, ***p<0.001, two-tailed Student’s t test.
(C) Ki-67 expression in CD44lo LN T-cells. Data shown are representative of three independent experiments.
(D) Ki-67 expression in CD44hi LN T-cells. Data shown are representative of three independent experiments.
(E) BrdU labeling of LN T-cells. LN T-cells were fixed and permeabilized before intra-nuclear staining with anti-BrdU antibodies. Data shown are representative of three mice of each genotype.
(F) Cell size of cultured γcKO and Pim1TgγcKO CD4+ LN T-cells. Freshly isolated LN T-cells were rested in medium for 36 hours. Cell size was assessed by determining FSC values at the end of the culture. Data shown are representative of three independent experiments.