
Figure 4.
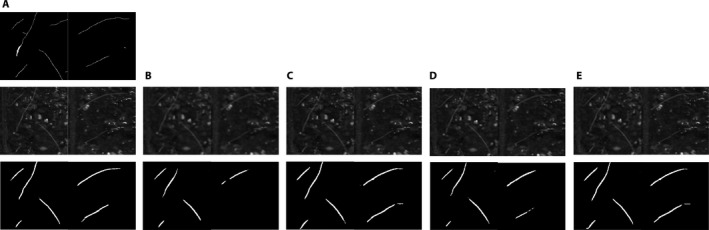
Super‐resolution and segmentation example images (128 × 64‐pixel size) from the soybean (Glycine max) data set. From top to bottom: (A) ground‐truth image, high‐resolution (HR) image, and segmentation on the HR image, (B) bicubic image and its segmentation, (C) output of the FSRCNN‐91‐image model and its segmentation, (D) output of the SRGAN‐MULDIS model and its segmentation, and (E) output of the FSRCNN‐91‐image&roots model and its segmentation.