
Figure 1. Single nuclei RNA-Sequencing reveals transcriptomic gradient of TRN neurons.
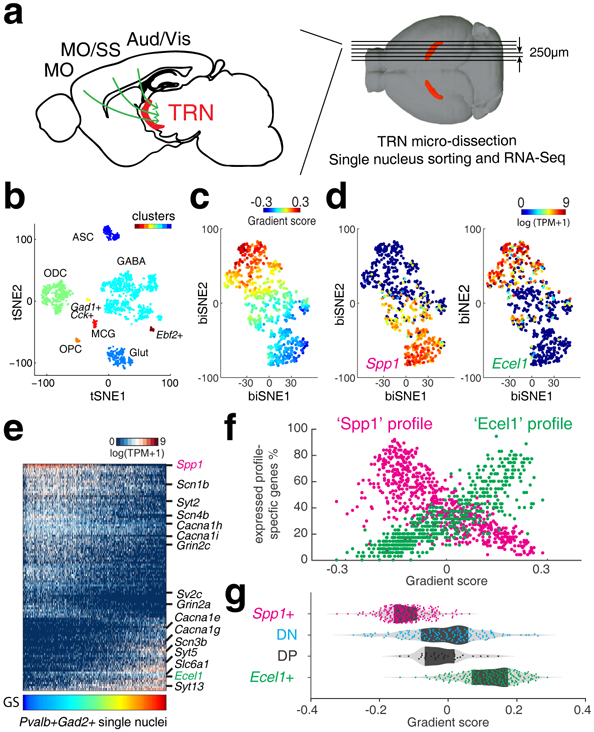
(a) Illustration of TRN gating on corticothalamo (CT) circuitry and experiments. Green arrows illustrate CT projection passing through TRN. MO: motor cortex; SS: somatosensory cortex; Aud: auditory cortex; Vis: visual cortex. Structure in red: TRN tissue (TdTomato). (b) t-SNE embedding shows nucleus clusters, indicated by colors. GABAergic cells (GABA), oligodendrocytes (ODC), Glutamatergic cells (Glut), oligodendrocyte precursor cells (OPC), microglia (MCG), astrocytes (ASC). n = 1,687 nuclei. (c) biSNE embedding of Gad2+ and Pvalb+ single nuclei, pseudo-colored by gradient score (GS), (d) by Spp1 (left) or Ecel1 (right) expression, showing two extremes marked by Spp1 or Ecel1, respectively. n = 671 nuclei. (e) Heat map showing Spp1- and Ecel1- associated transcriptional programs. Some genes relevant to electrophysiological properties are highlighted on the side. Columns: single nuclei; Rows: genes. (f) Scatter plot showing the percentage of ‘Spp1’ and ‘Ecel1’ profile-specific genes expressed in individual TRN cells along the transcriptomic gradient. (g) Distribution of TRN Spp1+, Ecel1+ and intermediate populations DN and DP, along the transcriptomic gradient.