
Figure 3. Topographical map of TRN-thalamus projections.
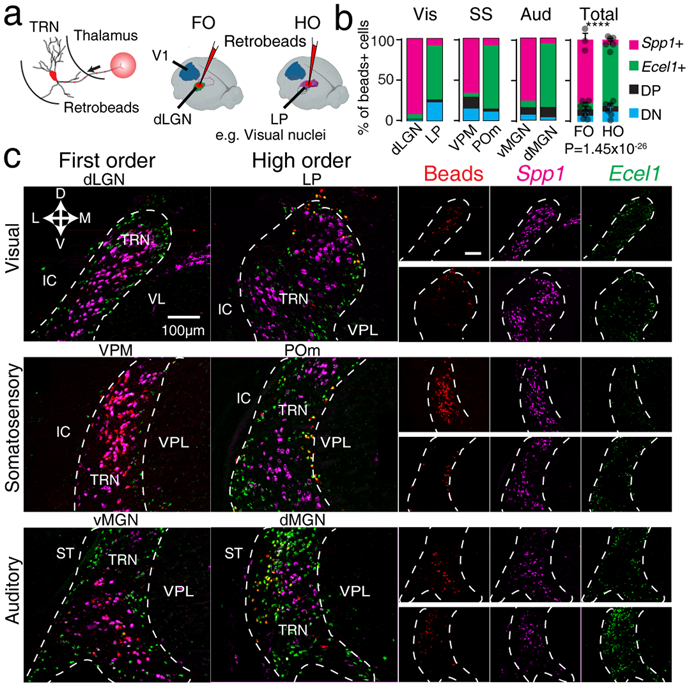
(a) Right: Experiment schematics illustrating injection of retrograde fluorescent beads (RetroBeads) in first-order (FO) or higher-order (HO) thalamic nuclei and retrograde tracing to the projecting TRN neurons. Left: an example illustrating tracing from FO (dLGN) and HO (LP) visual thalamic nuclei. (b) Percentage of Spp1+, Ecel1 +, DP and DN cells labeled by RetroBeads traced from injections targeting different thalamic nuclei, (p=1.45×10⁻²⁶ , two-sided χ-square test. Bars represent mean ± SD). (c) Retrograde tracing of TRN neurons by projecting to FO thalamic nuclei (dLGN, VPM and vMGN, left column) and HO nuclei (LP, POm and dMGN, right column) overlapped with RNA-FISH co-staining for Spp1 and Ecel1, showing high overlap of RetroBeads and Spp1+ staining when FO nuclei were injected and high overlap of RetroBeads and Ecel1+ when HO nuclei were injected. Separate channels are shown in the columns on the right side (upper row panels: injection in FO nuclei; lower row panels: injection in HO nuclei). VL: ventral lateral nucleus; ST: stria terminalis; VPL: ventral posterolateral nucleus. For (b) and (c), n = 3 mice per region.