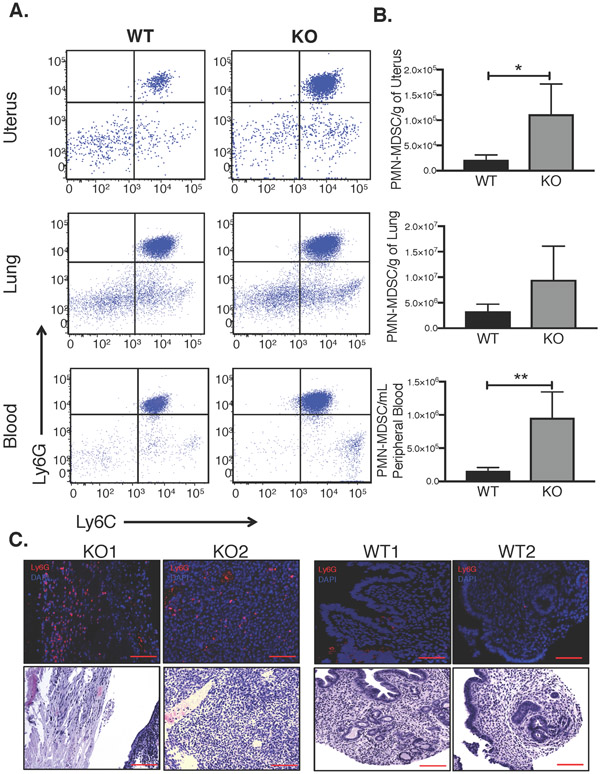
Figure 2. MDSCs levels are elevated in uterine-specific Tsc2-null mice.
A. Representative dot plots of granulocytic, or PMN-MDSC levels in blood and organs of 18-week old KO vs. WT mice. Dot plots depict Ly6G versus Ly6C expression gated on CD11b live cells in uterus, lung, and peripheral blood. B. PMN-MDSCs (Ly6C+/Ly6G+) in uterus, lung and peripheral blood were quantified in KO mice relative to WT mice and analyzed using unpaired two-tailed t test (n=4/group, *p<0.05, **p<0.01). C. Representative immunofluorescence staining for Ly6G (infiltrating PMN-MDSCs) and adjacent H&E stains in KO vs. WT mice is shown (top; scale bar, 100μm) and corresponding H&E staining on serial sections (bottom; scale bar, 100μm).

