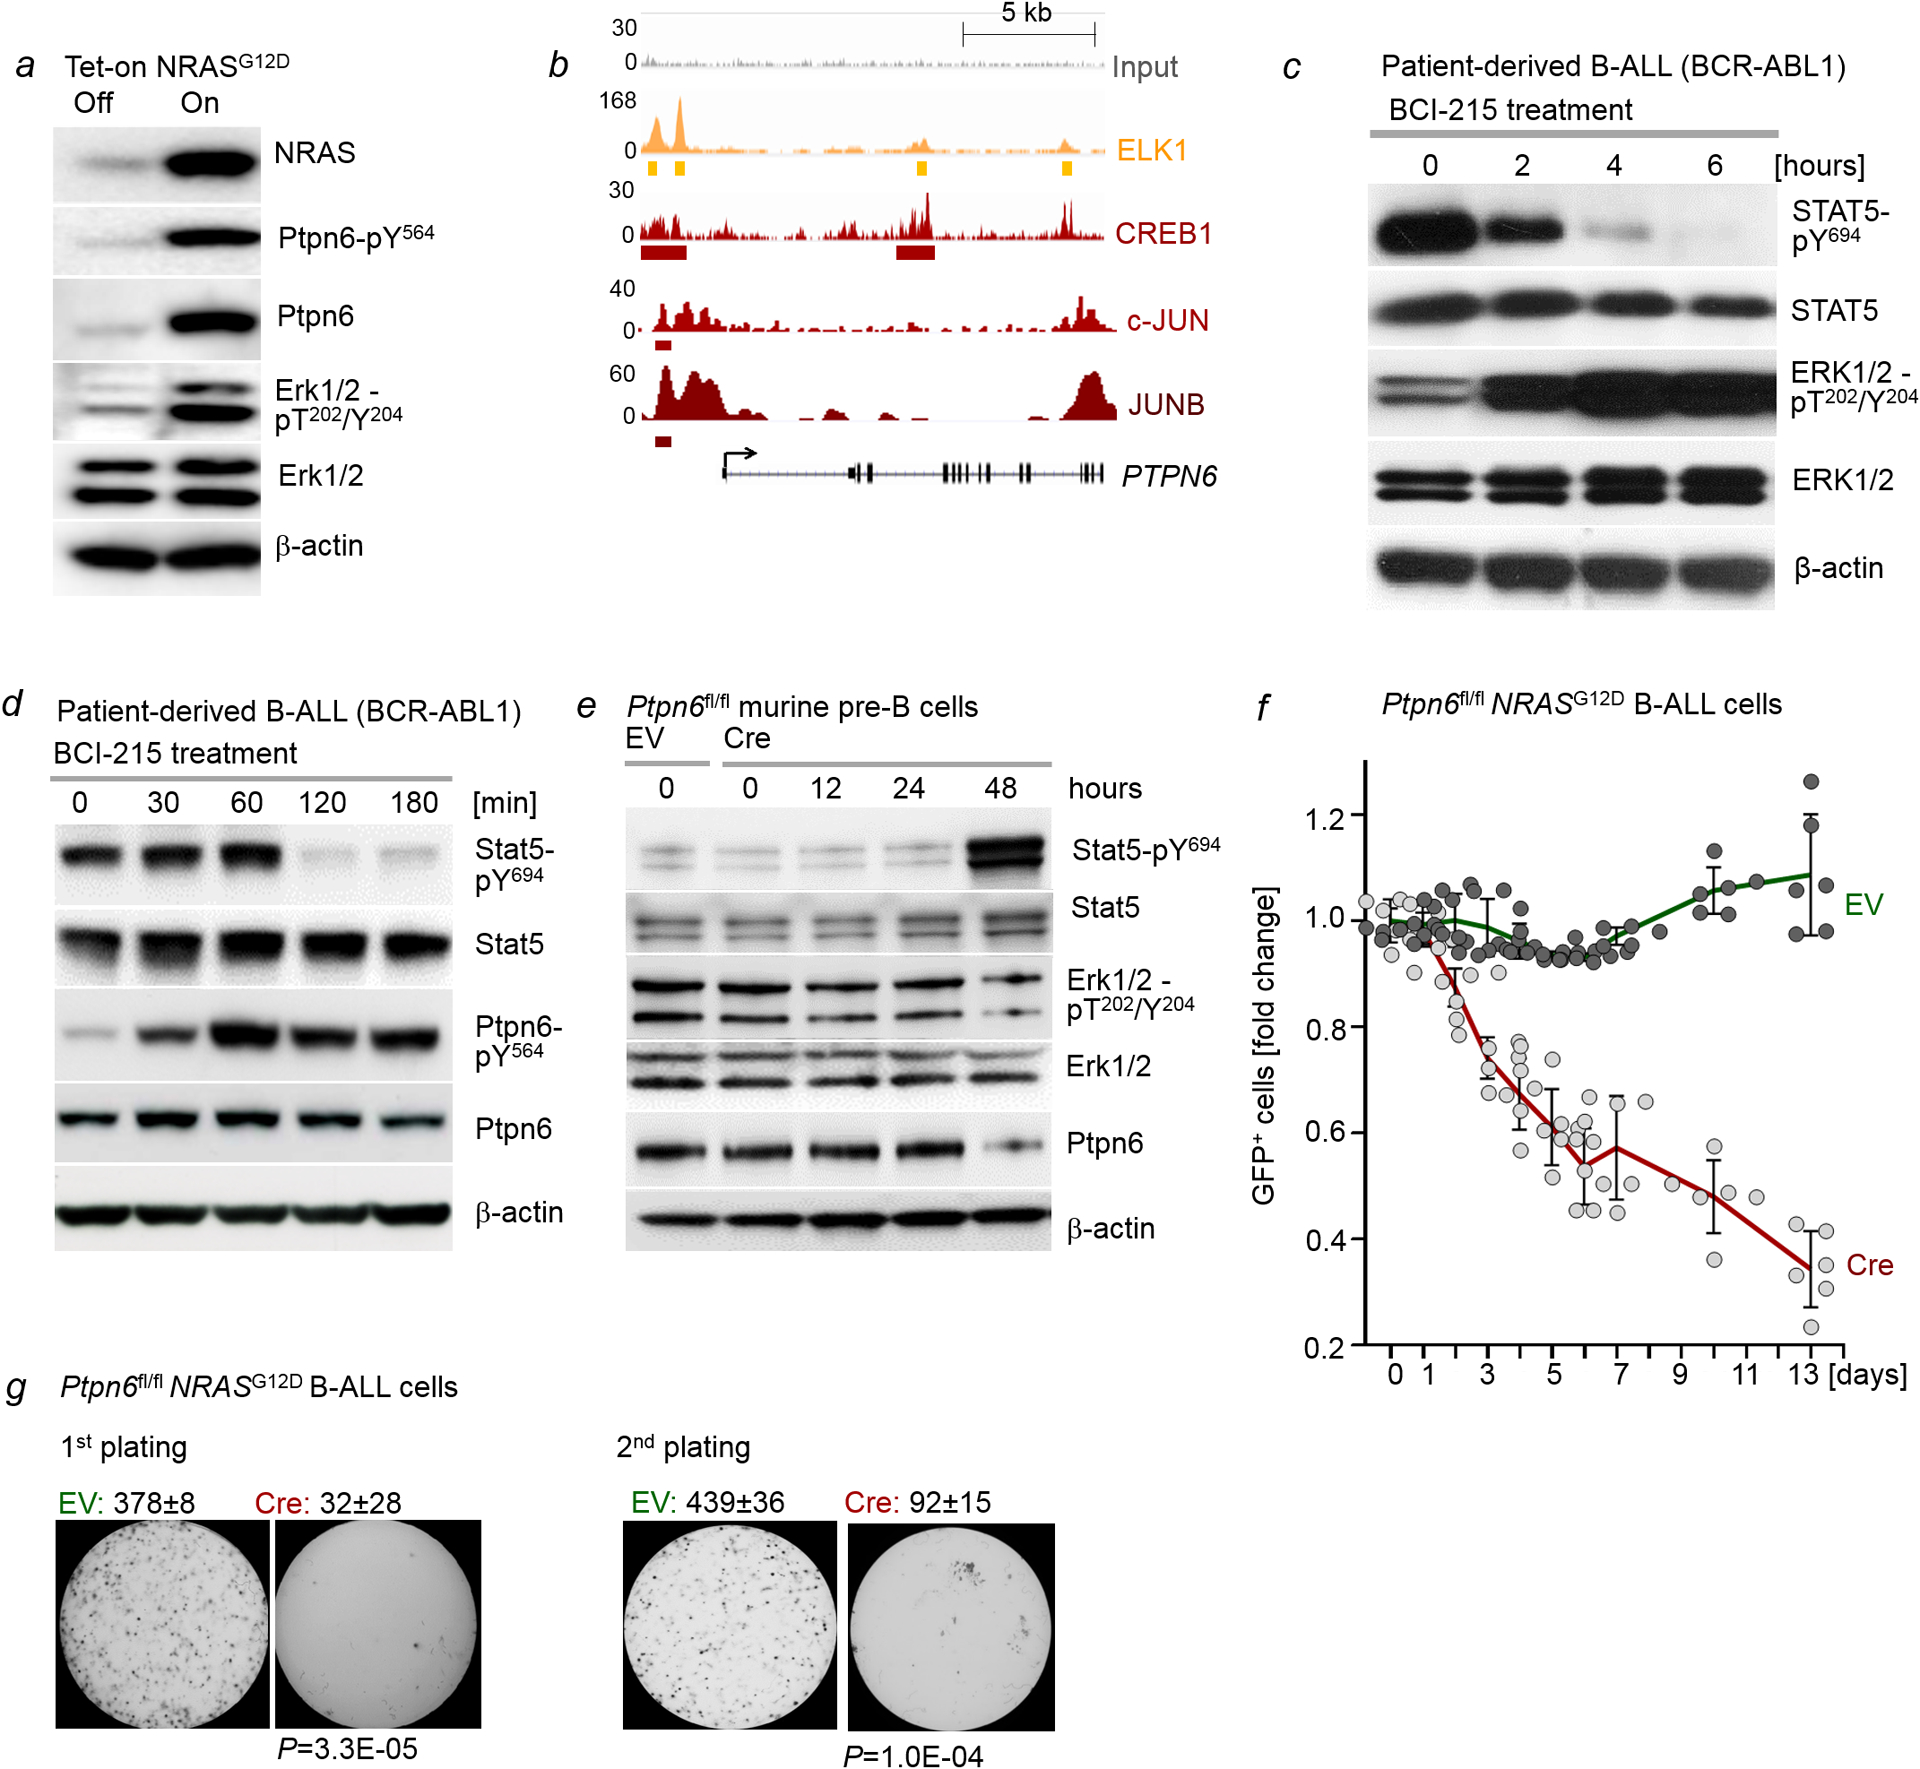
Extended Data Figure 7. Central role of PTPN6 in enabling oncogenic ERK-signaling.

a, Levels of NRAS, Ptpn6-pY564, Ptpn6, Erk1/2-pT202/Y204 and Erk1/2 were assessed by Western blotting following Dox-induced expression of NRASG12D in murine pre-B cells (n=3 independent experiments). b, ChIP-seq analyses in human B lymphocytes (GM12878) obtained from the Encyclopedia of DNA Elements (ENCODE) revealed binding of ERK-dependent transcription factors ELK1, CREB1, c-JUN and JUNB to the PTPN6 locus. c, Patient-derived B-ALL cells (PDX2) were treated with BCI-215 (1 μmol/l). Levels of phospho-STAT5-Y694, STAT5, phospho-ERK1/2-T202/Y204 and ERK1/2 were measured by Western blotting upon treatment with BCI for various time points (n=3 independent experiments). d, Patient-derived B-ALL cells (PDX2) were treated with BCI-215 (1 μmol/l). Levels of phospho-STAT5-Y694, STAT5, phospho-Ptpn6-Y564 and Ptpn6 were measured by Western blotting upon treatment with BCI for various time points (n=3 independent experiments). e, Ptpn6fl/fl B-cell precursors were transduced with 4-OHT-inducible Cre or EV. Levels of Stat5-pY694, Stat5, Erk1/2-pT202/Y204, Erk1/2 and Ptpn6 were measured at various time points following induction (n=3 independent experiments). f, Ptpn6fl/fl B-cell precursors expressing NRASG12D were transduced with GFP-tagged, 4-OHT-inducible Cre or EV. Following induction with 4-OHT, enrichment or depletion of GFP+ cells was monitored by flow cytometry. Shown are average relative changes (mean ± s.d.) of GFP+ cells following induction and representative FACS plots (n=6 independent biological replicates). g, Quantification (n=3 independent experiments, mean ± s.d.) and representative images from serial replating assays of pre-B cells transduced with NRASG12D following Cre-mediated deletion of Ptpn6. 10, 000 cells were seeded in semi-solid methylcellulose and monitored for colony formation for 14 days. P-values were determined by two tailed t-test. For gel source data, see Supplementary Fig. 1.
