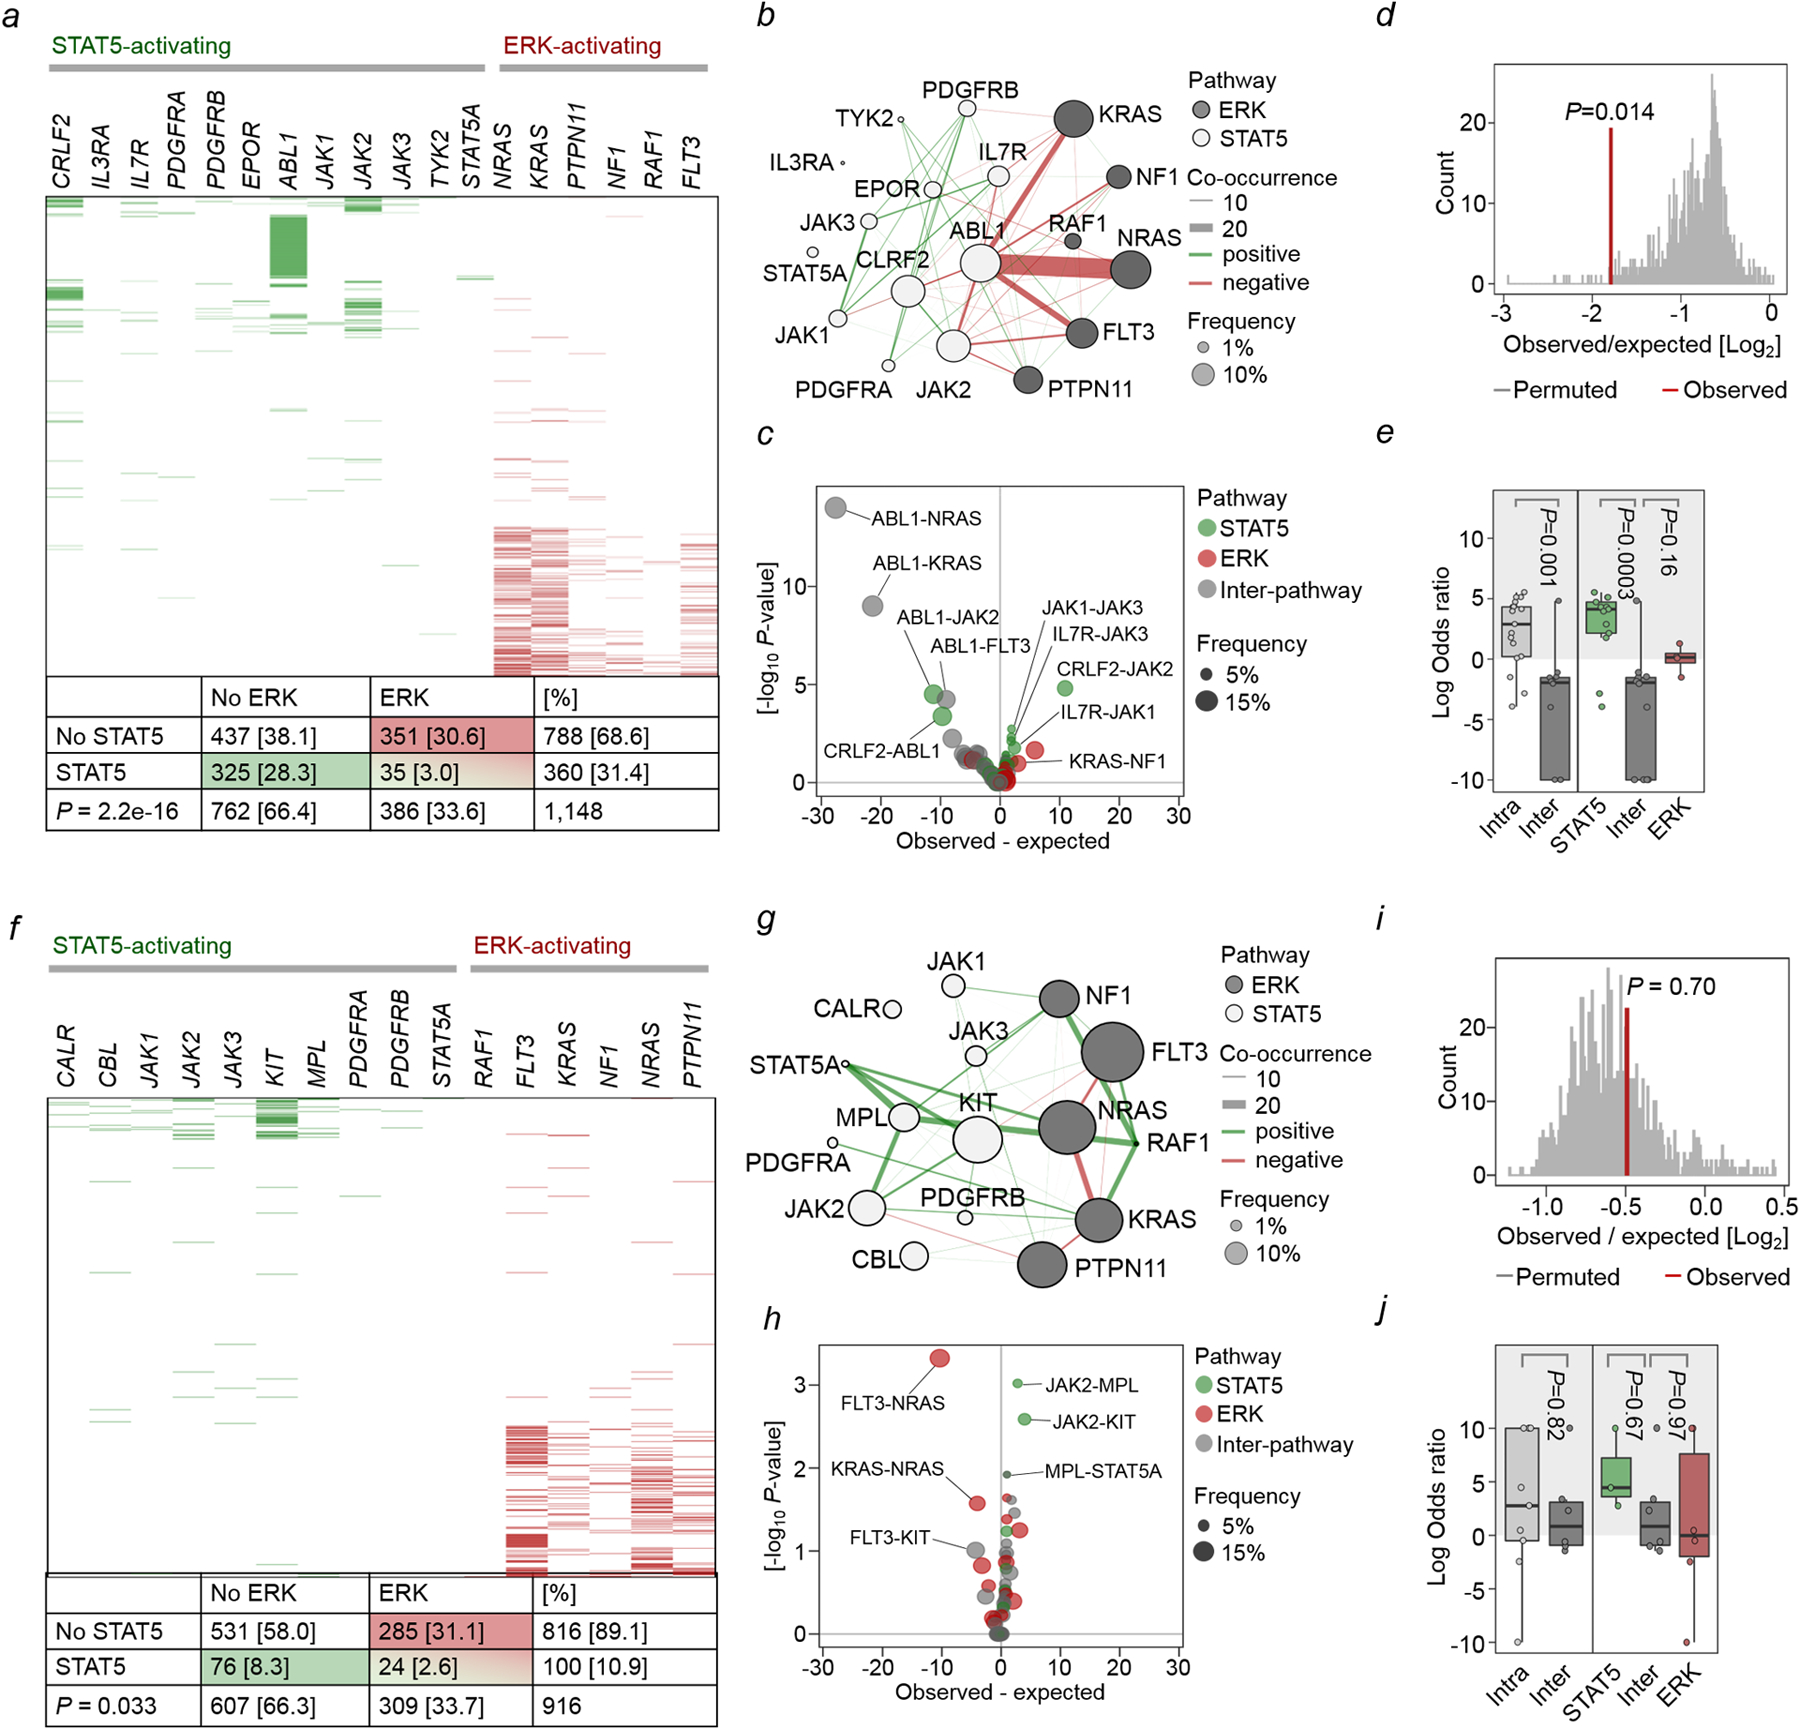
Extended Data Figure 1. Segregation of STAT5- and ERK-activating mutations in human ALL and AML.

a-e, STAT5- and ERK-pathway mutations were studied in 1,148 patient-derived B-ALL samples (Supplementary Table 1). Null hypothesis is that STAT5- and ERK-pathway mutations occur independently of each other. The expected co-occurrence of mutations in both pathways under the null hypothesis was 121. The observed co-occurrence of the two mutations was 35, significantly lower than the expected (a; OR=0.13; P=2.2e-16, Fisher’s exact test). b, To analyze gene-gene co-occurrence in a more unsupervised manner, Fisher’s test was run for each gene-pair and plotted as a co-occurrence network – pathway assignment for each gene is indicated by node color (white = STAT5, grey = ERK), and mutation frequency by node size. Direction of Fisher’s result is indicated by line color (green = positive/greater than expected, red = negative/less than expected), line width represents strength of association (–log10 p-value * |logOR|). OR: odds ratio. c, Volcano plot of gene-gene co-occurrence results. Each point represents a gene-pair, colored by pathway assignment for the pair (green = both STAT5, red = both ERK, gray = inter-pathway), selected gene pairs are labeled. Overall difference in co-occurrence between pathways was tested by two complementary methods: d, Firstly, Fishers test was run over 10,000 permutations with random shuffling of gene-pathway assignments on each iteration to generate a null distribution for the hypothesis that pathway does not affect co-occurrence, and compared against the observed value from ALL patient data. e, Secondly, overall shifts in the distribution of logORs between pathways for Fisher’s results on individual gene-pairs were tested by Welch’s two-sample t-test (left panel; two-sided, P=0.001), and one-way ANOVA (right panel; P=0.0004) with Tukey HSD post-test (P=0.0003 and P=0.16). Low frequency, non-significant gene-pairs were excluded to avoid extreme odds ratios from biasing results. f-j, The same analyses were carried out on 916 patient-derived AML samples (Supplementary Table 2). Expected co-occurrence of mutations in both pathways under the null hypothesis was 34, observed co-occurrence was 24, significantly lower than the expected (f; OR=0.59, P=0.033, Fisher’s exact test). j, Welch two sample t-test (left panel; two-sided, P=0.82), one-way ANOVA (right panel; P=0.57).
