
Extended Data Figure 2. Single-cell phosphoprotein analyses of patient-derived B-ALL samples reveal segregation of STAT5- and ERK-phosphorylation to competing clones.
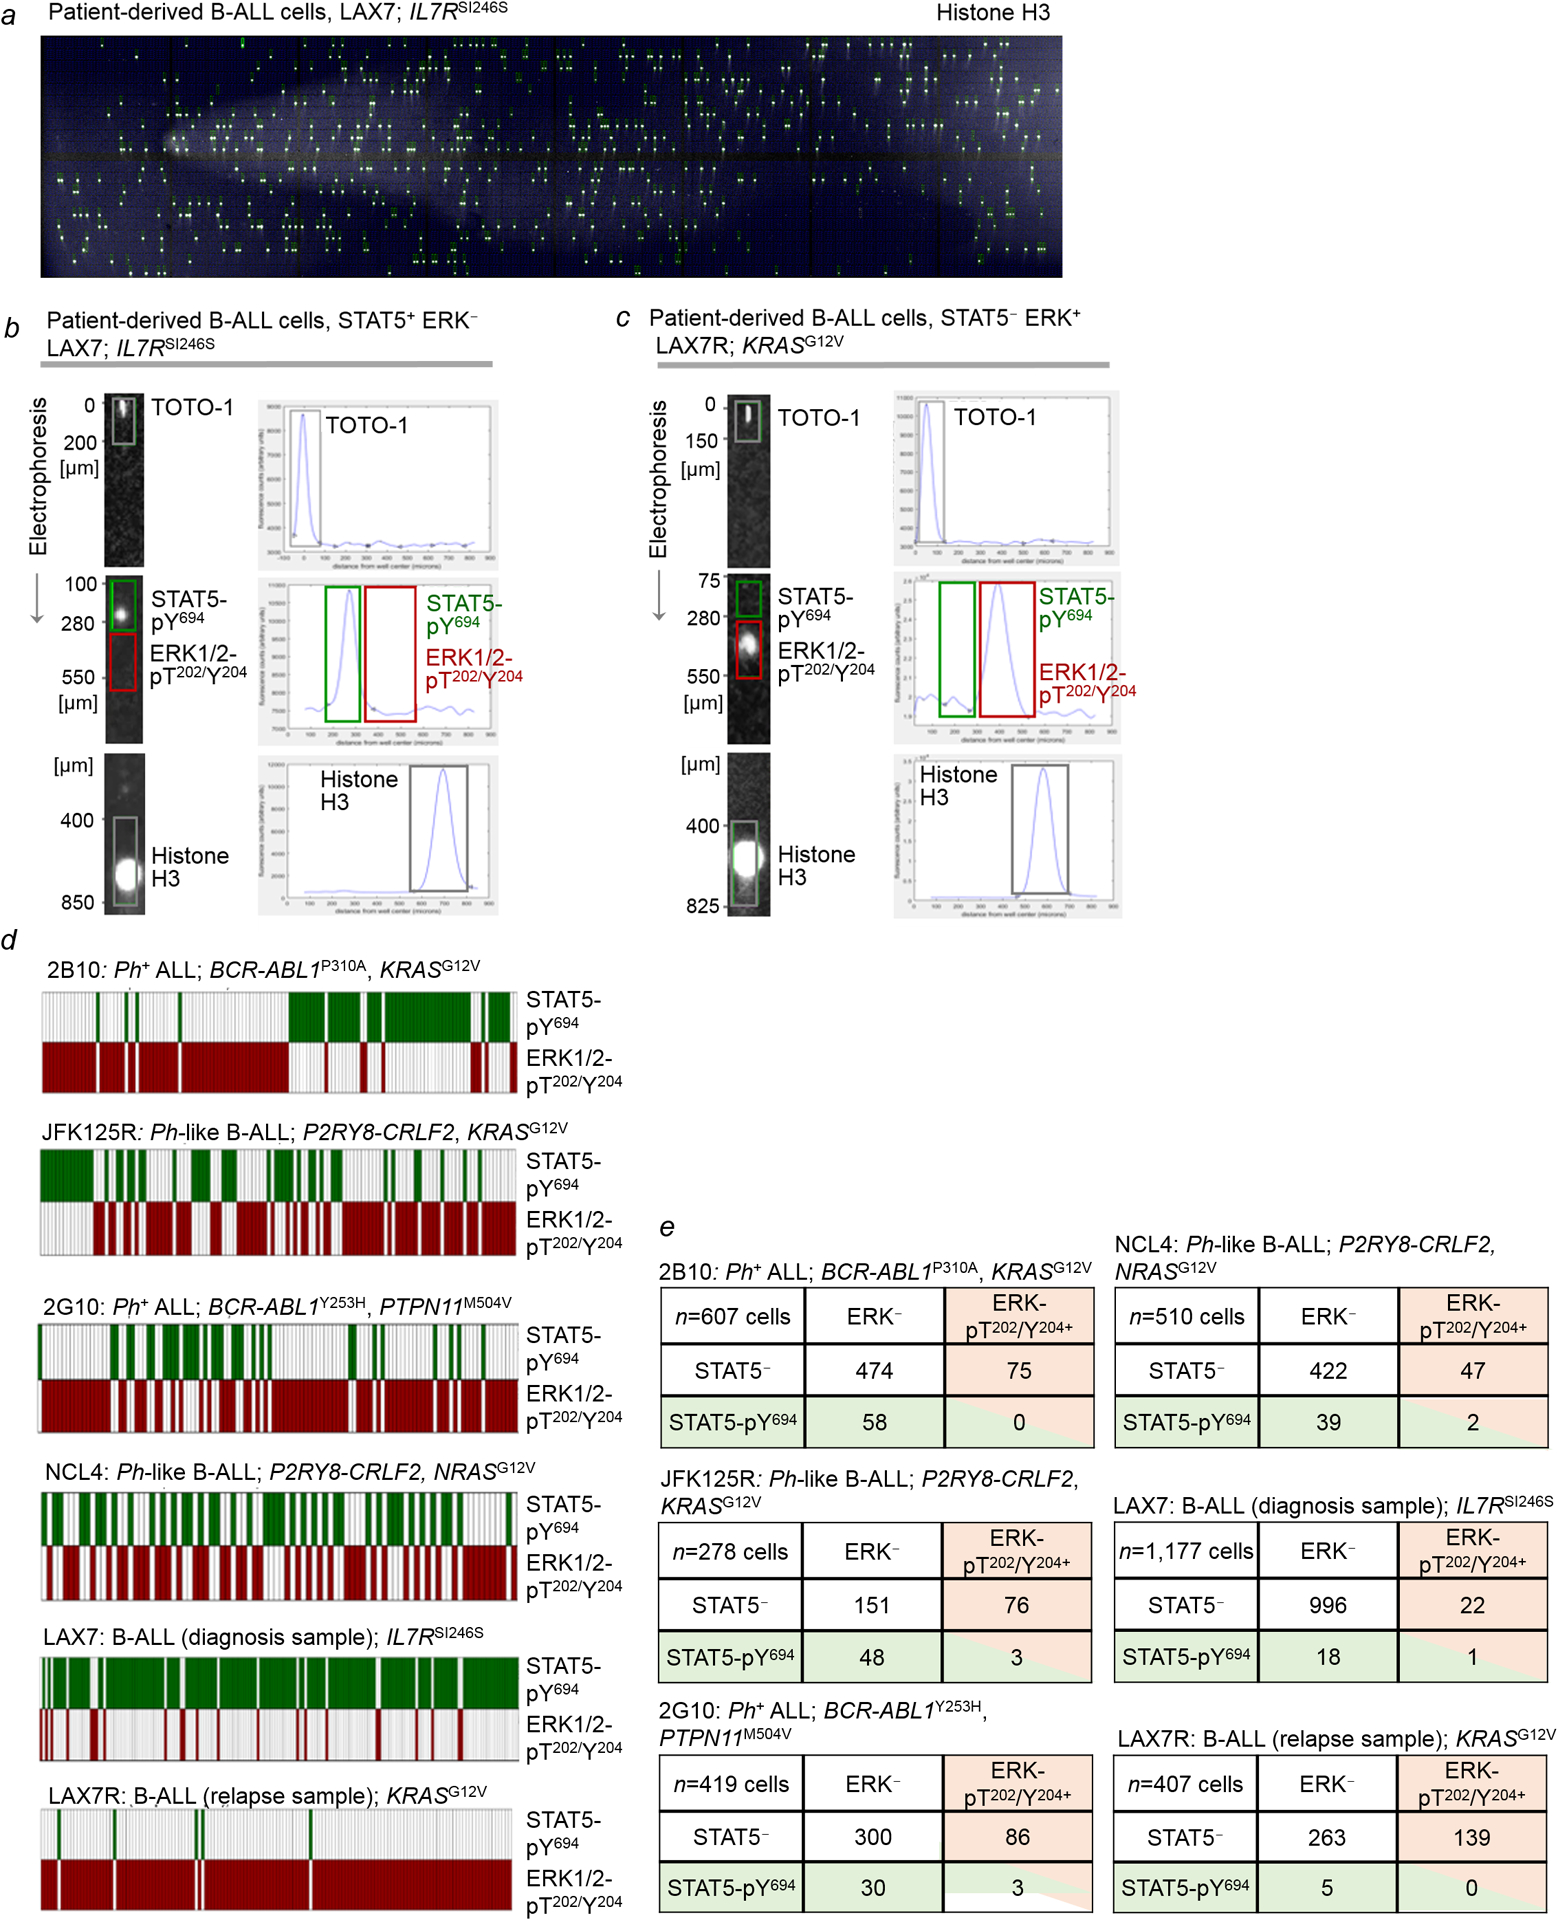
a-e, For single-cell phosphoprotein analyses, scWest chips were used to capture individual cells and perform size-based protein separation. Each chip includes 16 arrays of 400-well blocks (6,400) on a polyacrylamide gel. Single-cell suspensions of patient-derived B-ALL cells were loaded onto the scWest chip and inserted into Milo (ProteinSimple) for cell lysis, size-based protein separation and UV capture to immobilize protein bands. Representative scanned image of the scWest chip probed with Histone H3 antibodies to confirm cell occupancy, followed by fluorescent secondary antibodies (a; n=16 independent biological samples). Chips were probed with STAT5-pY694 and ERK-pT202/Y204 antibodies followed by fluorescent secondary antibodies for simultaneous detection of both phosphoproteins. Shown are representative images of signals observed for STAT5-pY694 and ERK-pT202/Y204. Fluorescence intensity was plotted against distance from well center (peak location, μm). In addition to histone H3, chips were stained for DNA using TOTO-1 dye to verify cell occupancy. Each signal was inspected to confirm it was associated with a peak located at the correct distance from the well center (b,c; n=16 independent biological samples, each in triplicate). Chip was scanned using a microarray scanner, and peak identification was performed using the Scout Software (ProteinSimple). For single-cell Western analyses, optimal cell loading is achieved when 2% or fewer wells contain multiple cells (https://www.proteinsimple.com/milo.html). d,e, Single-cell phosphoprotein analyses for STAT5-pY694 and ERK-pT202/Y204 were performed for patient-derived B-ALL samples (6 independent biological samples, each in triplicate) with STAT5-pY694 and ERK-pT202/Y204 antibodies for simultaneous detection of both STAT5- and ERK-phosphorylation. scWest chips were then probed for histone H3 and TOTO-1 (DNA stain) to verify cell occupancy. Scout Software (ProteinSimple) was used for peak identification and data analysis. Each data point was inspected to confirm the signal detected was associated with a peak located at the correct peak location (distance from the well center). Shown in (d) are heatmaps illustrating cells that express STAT5-pY694 (green) and/or ERK-pT202/Y204 (red). Shown in (e) are tables that summarize the number of cells expressing neither STAT5-pY694 nor ERK-pT202/Y204 and the number of cells expressing either STAT5-pY694 or ERK-pT202/Y204, or in rare cases, both. For single-cell Western analyses, optimal cell loading is achieved when 2% or fewer wells contain multiple cells.