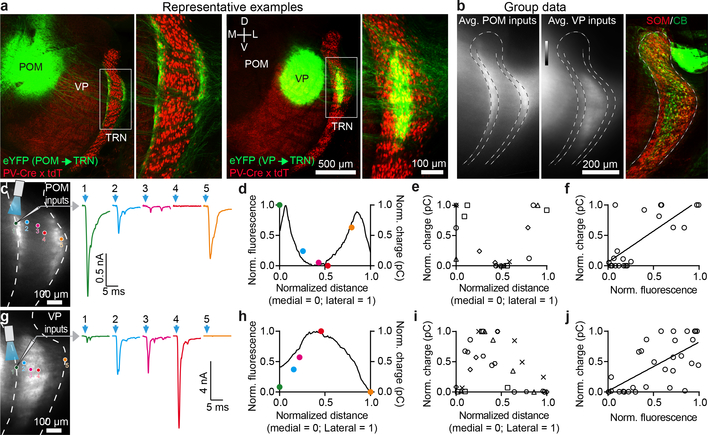
Figure 2. VP, a first-order thalamic nucleus, targets central somatosensory TRN, whereas POM, a higher-order nucleus, targets the TRN edges.
a, Confocal images illustrating the distinct projections from POM and VP to TRN. AAV2-ChR2-eYFP was injected in POM (left) or VP (right) and projections to TRN characterized.
b, Group data showing average thalamic projections to TRN. Viral anterograde tracing as in (a). POM targeted the edges of somatosensory TRN (n=9 mice). VP targeted the central zone (n=8 mice). Central/edge boundaries drawn at 20% and 80% of medial-lateral distance across TRN. Right, average SOM/CB immunohistochemical profiles (n=5 mice) aligned to same reference TRN as anterograde projection maps.
c, Synaptic responses to POM input from cells across the TRN, testing how synaptic strength relates to anterograde fluorescence and topographical location. Left, image of live TRN (outlined) with ChR2-eYFP projections from POM. Circles show locations of recorded cells. Right, EPSCs evoked in TRN cells by optical activation of POM axons (−84 mV). Colors match cells in left image and (d).
d, Normalized fluorescence (black line) and synaptic charge (colored dots) for cells in (c), versus medial-lateral position in TRN.
e, Group relationship between TRN soma location and evoked synaptic response. Somas close to the TRN edges responded strongly to POM and those in the center did not (for e-f, n=21 cells, 5 slices, 5 mice; each prep has unique symbol).
f, TRN cells’ synaptic responses to POM input (normalized charge) correlated with fluorescence from POM axons surrounding the cell (r=0.75, p<0.0001, two-tailed Pearson’s correlation).
g-h, Same as (c-d), except activating VP input.
i, Group data showing that somas near the TRN center respond more strongly to VP input than those near the edges (for i-j, n=31 cells, 6 slices, 4 mice).
j, TRN cell’s synaptic responses to VP input correlated with fluorescence from VP axons surrounding the cell (r=0.68, p<0.0001, two-tailed Pearson’s correlation).

