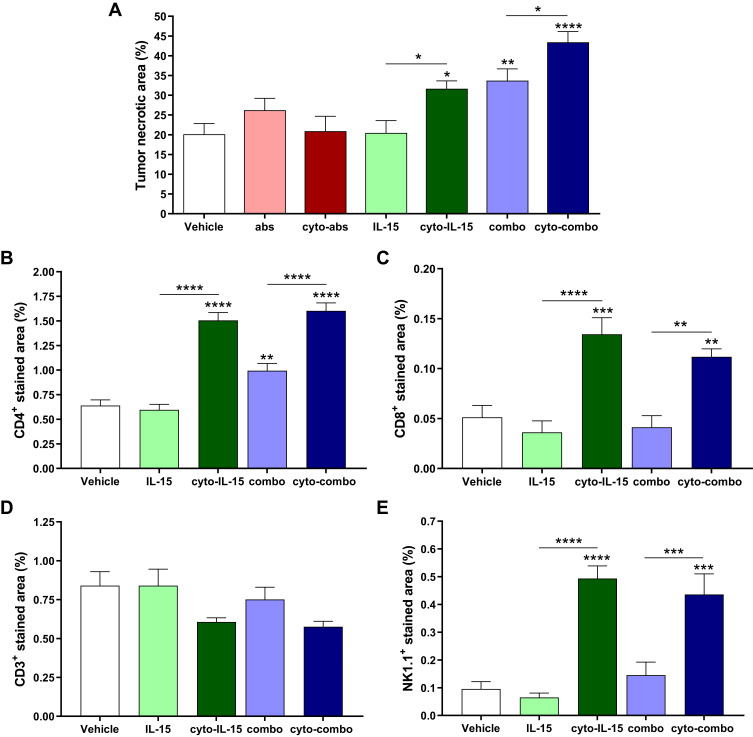
Figure 5.
Quantification of necrotic area and immune cell infiltration in TRAMP-C2 tumors. (A) Necrotic area. Results are means +1 SEM of two sections per tumor for all tumors. (B) CD4 positive-stained area, (C) CD8 positive area, (D) CD3 positive area, and (E) NK1.1 positive-stained area. Results are means +1 SEM of 10 images per tumor for n = 5 per group. Comparisons are relative to vehicle unless otherwise indicated (*p <0.05, **p <0.01, ***p <0.001, ****p <0.0001 one-way ANOVA with Dunnett’s multiple comparisons post-test).

