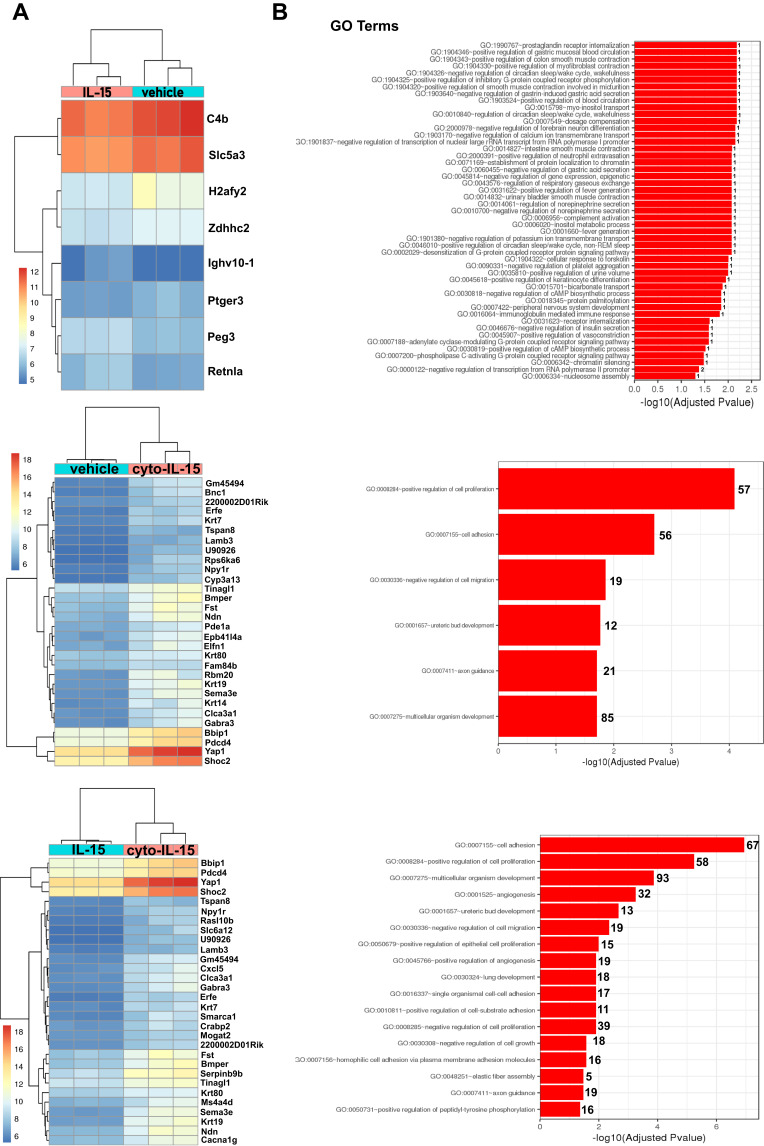
Figure 6.
Effects of cyto-IL15 treatment on gene expression in TRAMP-C2 tumors. Differential gene expression analysis followed by gene ontology analysis were performed between tumors treated with vehicle or IL-15 (top panel), with vehicle or cyto-IL-15 (middle panel), and with IL-15 or cyto-IL-15 (bottom panel) (n = 3/cohort). (A) Bi-clustering heatmaps of the log2 transformed expression values in each sample showing the expression profiles of the top 30 differentially expressed genes (all 8 differentially expressed genes are shown in the vehicle versus IL-15 comparison). (B) Gene ontology (GO) enrichments of all significantly differentially expressed genes (adjusted p-value < 0.05) for each of the three comparison sets. The numbers next to the bars indicate the number of significantly differentially expressed genes involved in each biological process.

