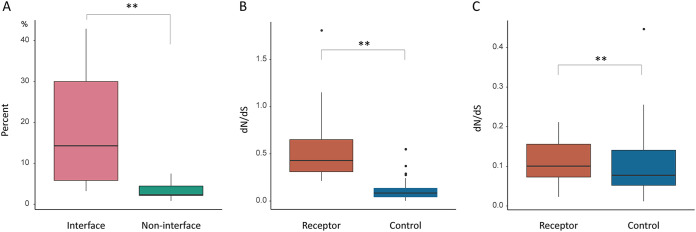
FIG 3.
Analyses of selection pressure in receptor genes. (A) The comparison of the proportion of positively selected sites at the virus-host interacting interfaces with that in other locations for seven viral receptors. The pink box represents the proportion of positively selected sites at the interfaces, and the green box represents the proportion of positively selected sites at other locations. (B and C) Hierarchical comparison of selective pressures between receptor and control genes. The receptor genes were divided into two parts, viral receptor genes with top 50% dN/dS values (B) and the other viral receptor genes (C), based on their dN/dS values. The difference in selection pressure between viral receptor genes and the corresponding control genes then was compared.

