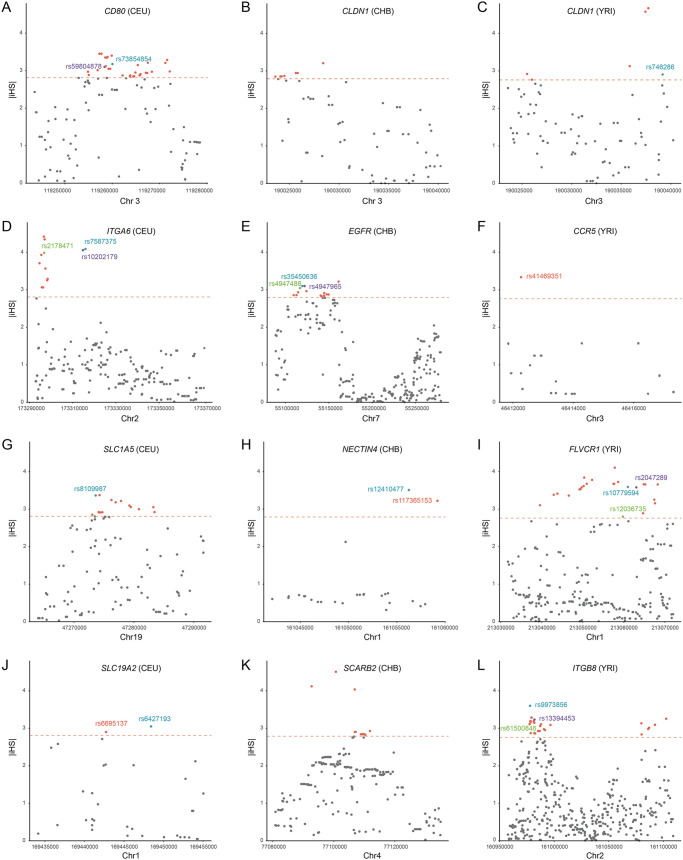
FIG 6.
Selection and population differentiation of representative viral receptors. The |iHS| scores of SNPs within 11 representative receptor genes (CCR5, CD80, CLDN1, EGFR, FLVCR1, ITGA6, ITGB8, NECTIN4, SCARB2, SLC19A2, and SLC1A5) are shown. The dashed line represents the top 1% of the |iHS| scores at the genome-wide level. The outlying SNPs with Fst of greater than 0.15 between different populations are labeled in different colors.

